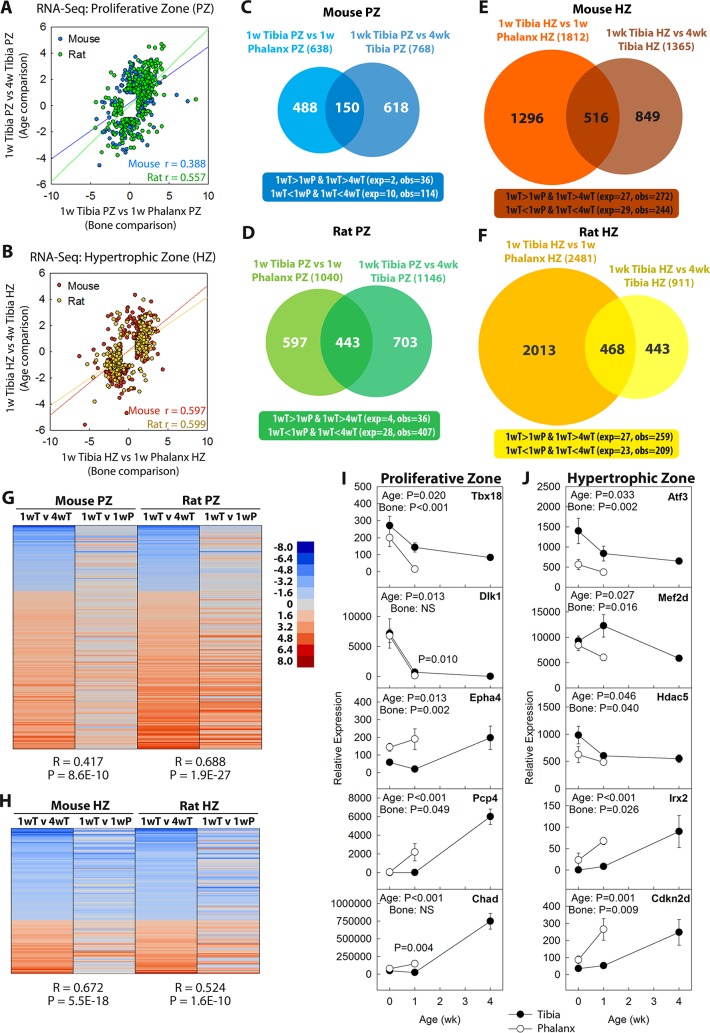
Fig 3. Growth plate senescence-associated changes in gene expression are more advanced in the phalangeal growth plates than in tibial growth plates.
RNA-Seq was performed on laser capture micodissected PZ or HZ of mouse or rat proximal tibias (at age 1 and 4 weeks) or proximal phalanges (at 1 week). (A, B) Positive correlation (mouse PZ, p < 1 × 10−44; mouse HZ, p < 1 × 10−139; rat PZ, p < 1 × 10−254; rat HZ, p < 1 × 10−281; Pearson’s correlation) between senescent changes (log2[fold differences]) in tibial growth plate (1 week versus 4 weeks, >4-fold; FDR < 0.05) and differential expression between bones at 1 week (tibia versus phalanx >4-fold; FDR < 0.05), in PZ (panel A) and HZ (panel B) of both species. (C–F) Venn diagram depicting numbers of genes with significant changes (>4-fold; FDR < 0.05) in expression between 1 and 4 weeks of age in tibial growth plates and/or significant differences between tibia and phalanx at 1 week of age. Overlaps were greater than expected by chance (chi-squared, p < 0.0001) in both zones of mouse (panel C and E) and rat (panel D and F). (G, H) Heatmap of genes showing senescence-associated changes in expression (1 versus 4 weeks in tibia; >2-fold, FDR < 0.05, in both species; 200 genes in PZ, 129 genes in HZ). The senescence-associated changes correlated with differential expression between 1-week phalanx and tibia, suggesting that senescence-associated changes are more advanced in phalanges than tibias (R, Pearson’s correlation coefficient). Scale bar represents log2(fold differences). (I, J) qPCR in a subset of genes showed that changes in gene expression (mRNA normalized to 18S RNA) began before 1 week of age and confirmed that changes in the phalanges tended to be more advanced than in tibias. p-Values for age and type of bone. Raw values are available in S1 Data. exp, number of overlapping genes expected by chance; FDR, false discovery rate; HZ hypertrophic zone; NS, not significant; obs, number of observed overlapping genes; P, phalanx; PZ, proliferative zone; qPCR, quantitative PCR; RNA-Seq, RNA sequencing; T, tibia; w, week.

