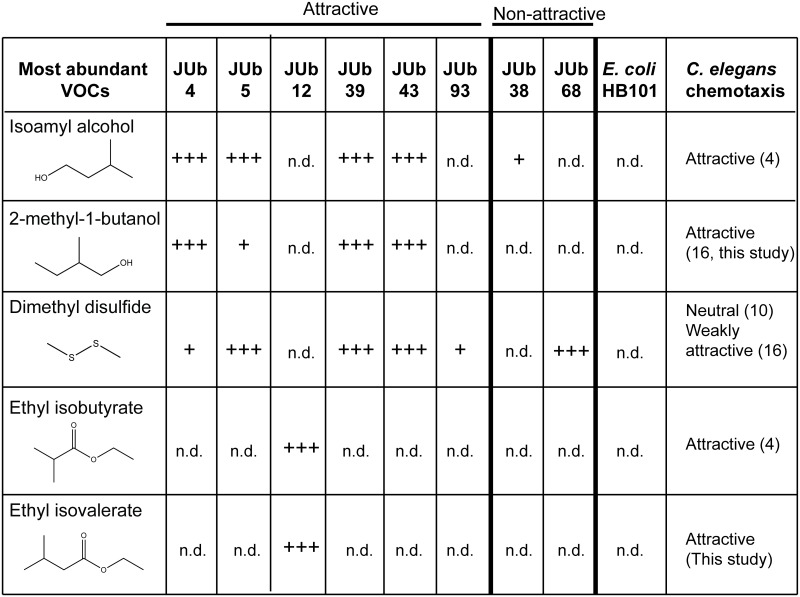
Fig 3. Summary of most abundant bacterial volatile organic compounds.
VOCs were identified by SPME-GC-MS and confirmed with known standards. +++ indicates high abundance VOC with total ion chromatogram (TIC) peak area greater than 6.0 × 10⁷ counts; + indicates low abundance VOC with TIC peak area between 1.0 × 10⁷ and 6.0 × 10⁷counts; n.d. indicates not detected. Data from at least two different experimental replicates on different days. Attraction to C. elegans determined by bacterial odor choice assay (Fig 1D).

