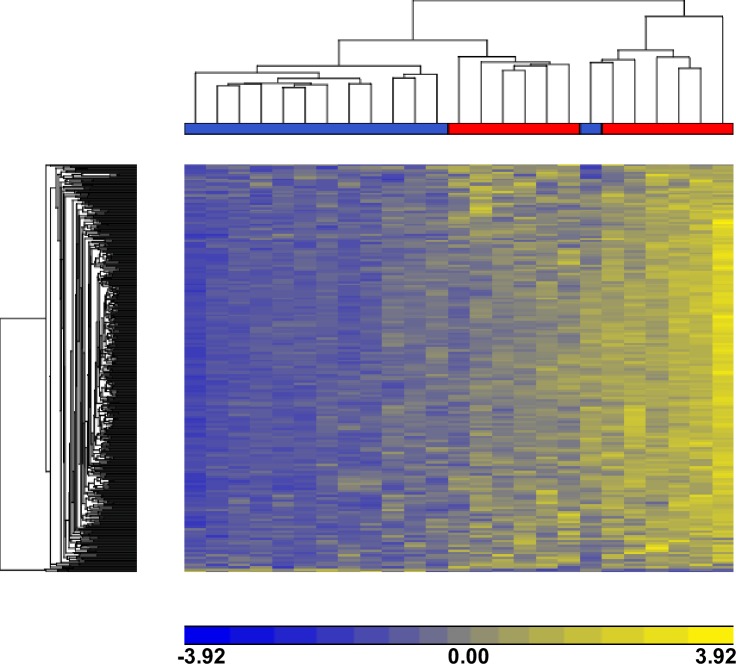
Fig 3. Unsupervised hierarchical clustering of 500 most variable CpG sites derived from samples distinguishes ME/CFS (N = 13) cases and controls (N = 12).
500 DMS above and below mean level are represented by blue and yellow across all cases and were used to cluster cases. As shown above, 12 of 13 ME/CFS cases (blue on color-coded bar above the dendrogram) cluster together (left dendrogram branch) and 12 of the 12 controls (blue color-coded bar) cluster together (right dendrogram branch), resulting in a divergence of these sub-phenotypes.

