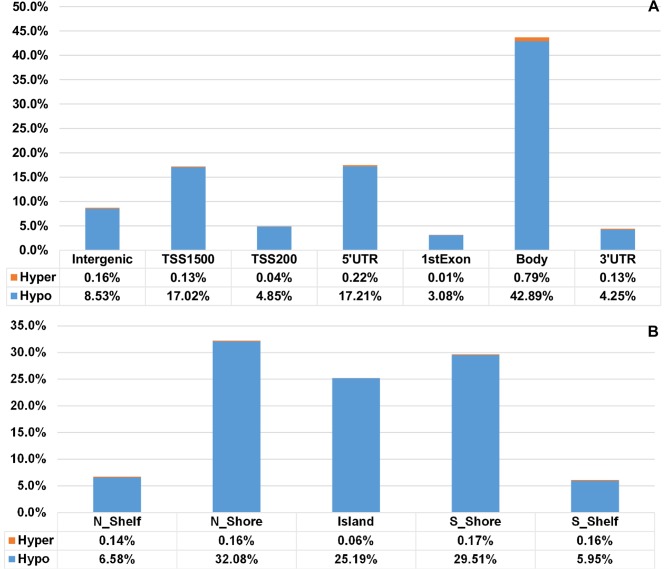
Fig 4. Distribution of differentially methylated sites according to genic location and to CpG island relation.
(A) Distribution of DMS according to genic location. Relative percentages of DMS (both hypo-methylated and hyper-methylated CpG sites between ME/CFS cases and controls) are reported for each genic body location: gene regulatory elements (regulatory: TSS1500, TSS200, 5’ UTR, 3’ UTR), the coding regions of genes (gene body), as well as all Intergenic and 1st Exon gene body regions. (B) Distribution of DMS according to their location in relation to CpG islands. Relative percentages of DMS (both hypo-methylated and hyper-methylated) are reported. CpG islands with clustered CpG sites; 2 kb upstream and downstream of CpG islands (N, S Shores); 2 kb upstream and downstream of CpG shores (N, S Shelves).

