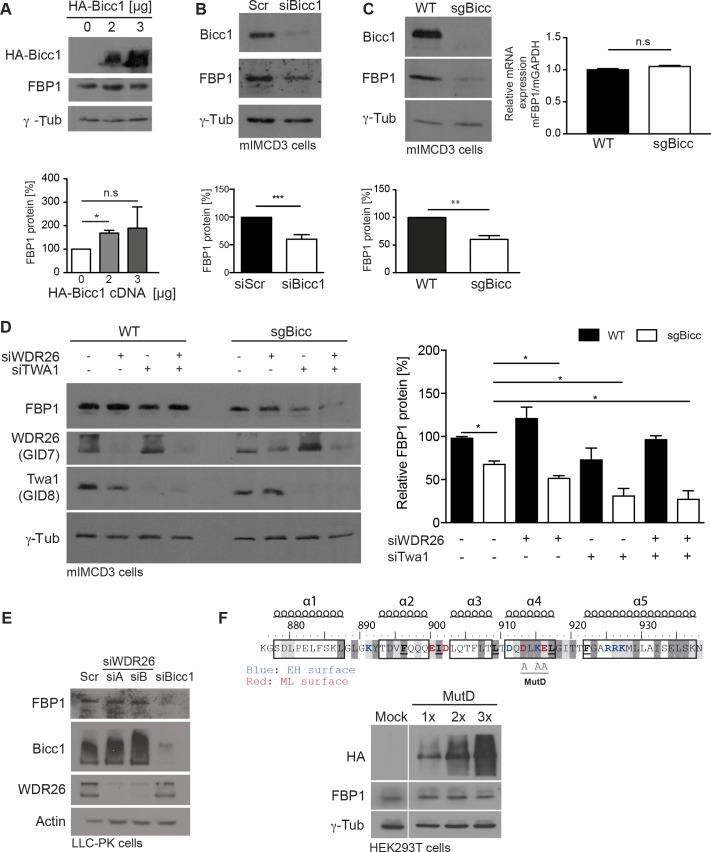
Fig 4. Endogenous Bicc1 in mIMCD3 cells increases FBP1 protein levels independently of its interaction with the CTLH complex.
(A) Western blot analysis of FBP1 in HEK293T cells transfected with the indicated dose of HA-Bicc1. Bars represent mean ± SEMs. *p <0.05. (B) Western blot of FBP1 in mIMCD3 48hrs after transfection of scrambled or Bicc1 siRNA. Below: Bars represent mean ± SEMs. ***p <0.001. (C) Western blot and RT-qPCR analysis (right) of FBP1 in mIMCD3 cells (WT) and a representative CRISPR-edited clone (sgBicc1) (n = 3 per genotype). For RT-qPCR GAPDH mRNA was used for normalization. Bars represent mean ± SEMs. **p <0.01 (D) Western blot of FBP1, WDR26 and Twa1 in mIMCD3 transfected with siScr or siWDR26 or siTWA1 siRNAs for 48 hrs. Error bars represent mean ± SEM of two experiments. *p <0.05. (E) Western blots of FBP1, Bicc1 and WDR26 in LLC-PK1 proximal tubule cells transfected with siScr or two different siWDR26 siRNAs (siA, siB) for 48 hrs. Data are representative of two experiments. (F) Western blots of HA-Bicc1 and FBP1 in HEK293T cells transfected with increasing doses of HA-Bicc1 MutD for 24 hrs. Top: Alanine substitutions in Bicc1 MutD (D913;K915;E916/AAA). Charged residues (red and blue) in end helix (EH) and mid loop (ML) surfaces of the dimerization interface in the SAM domain and their conservation determined by ClustalW (grey shading), as well as the positions of 5 α helices are indicated.

