Figure 6.

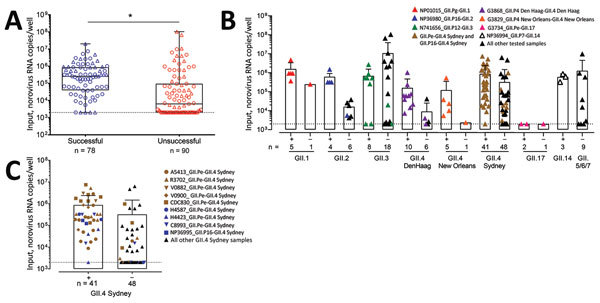
Comparison of amount of input viral RNA with success of human norovirus replication in human intestinal enteroids (HIEs). A) We infected HIE monolayers with undiluted or prediluted (1:10; 1:100; 1:1000) 10% fecal filtrates. Each dot represents the input norovirus RNA per well of a single experiment (n = 168) that resulted in successful (n = 78) or unsuccessful (n = 90) virus replication. Boxes represent 25th percentile, median, and 75th percentile, and whiskers show the minimum and maximum values. Circles indicate GII.4 genotypes and triangles non-GII.4 genotypes. ***p<0.001 by Mann-Whitney test. B, C) Role of initial norovirus RNA input in successful (+) and unsuccessful (–) human norovirus infections. We infected HIE monolayers with undiluted or prediluted (1:10; 1:100; 1:1000) 10% fecal filtrates and incubated them at 37°C in 5% CO2 for 3 d. We extracted RNA and quantified it by quantitative reverse transcription PCR from frozen lysates (cells and supernatant) at 1 hour postinfection and 3 days postinfection. Data points represent individual experiments. Bars represent mean + SD. Dotted lines represent RT-qPCR limit of detection. Samples that successfully replicate at high, but not low, concentration are colored and listed in Table 2.
