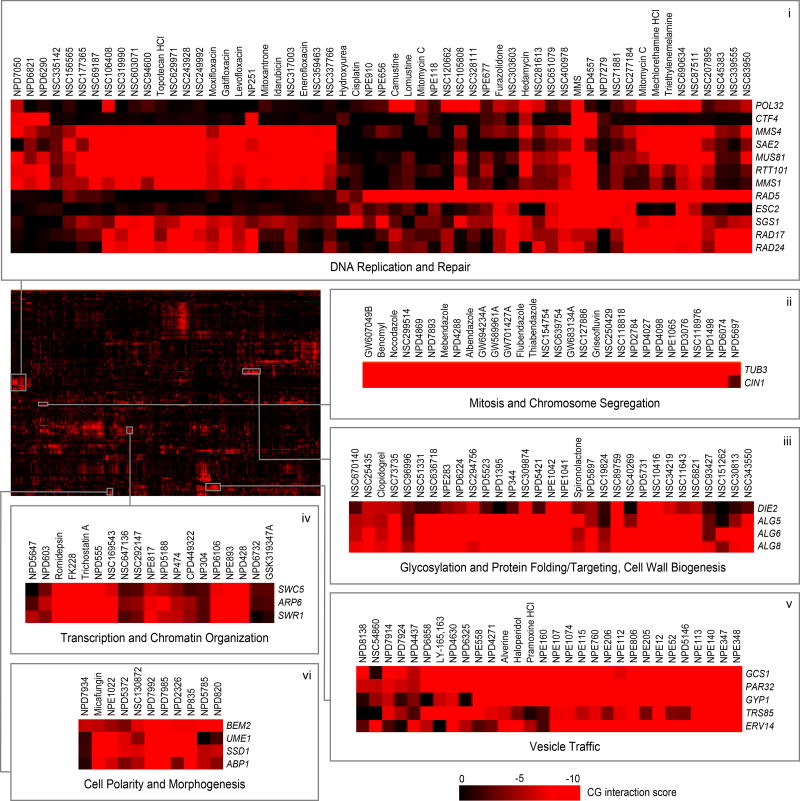
Figure 2. Two-dimensional hierarchical clustering of chemical-genetic interactions.
Mean negative chemical-genetic interactions are represented in red (n=3, technical replicates). Rows, 173 deletion mutant strains; columns, 1380 bioactive compounds from the high confidence set (HCS). Sections are expanded to allow detailed visualization of compounds targeting processes related to DNA replication & repair (i), mitosis and chromosome segregation (ii), glycosylation, protein folding/targeting, and cell wall biogenesis (iii), transcription and chromatin organization (iv), vesicle traffic (v), cell polarity and morphogenesis (vi).

