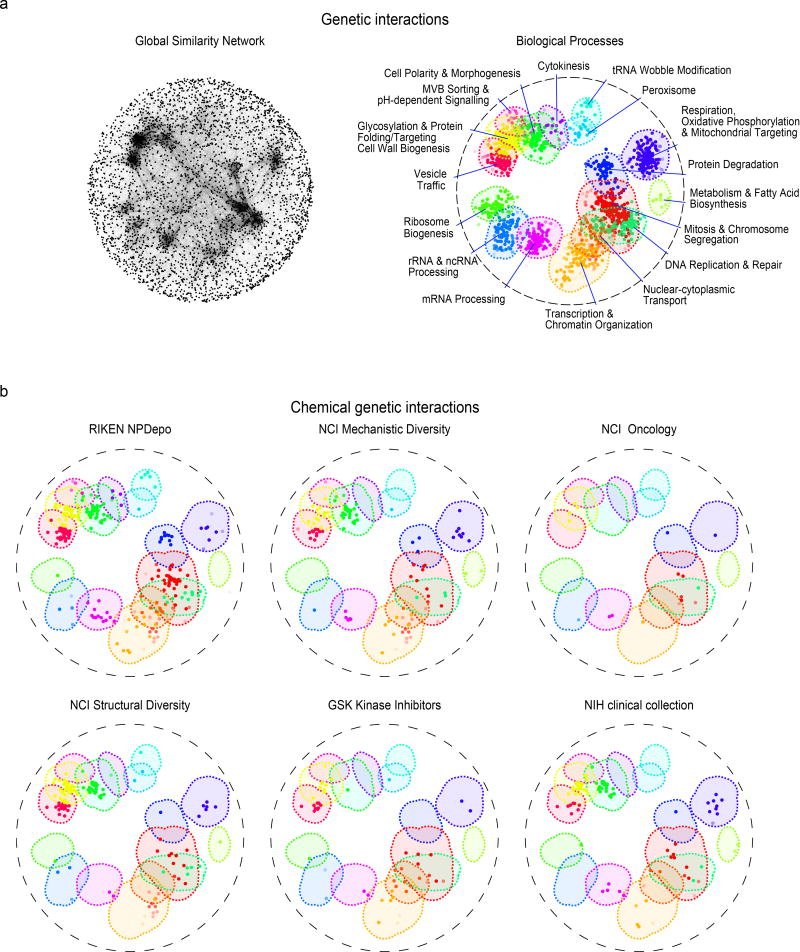
Figure 3. The functional landscape of diverse compound collections.
(a). The global genetic interaction similarity network. (a left panel) Genes (nodes) that share similar genetic interaction profiles are connected by an edge in the global genetic interaction similarity network. Genes sharing highly similar patterns of genetic interactions are proximal to each other; less-similar genes are positioned further apart. (a right panel) Densely connected network clusters, color coded by functional enrichments annotations to 17 distinct biological processes. (b) Integrating genetic and chemical-genetic interaction profiles to predict biological processes targeted by HCS compounds. Colored nodes represent chemical compounds derived from the indicated collection. Each compound was placed on the map at the position of the gene with the most similar genetic interaction profile from the compound’s top predicted target process.

