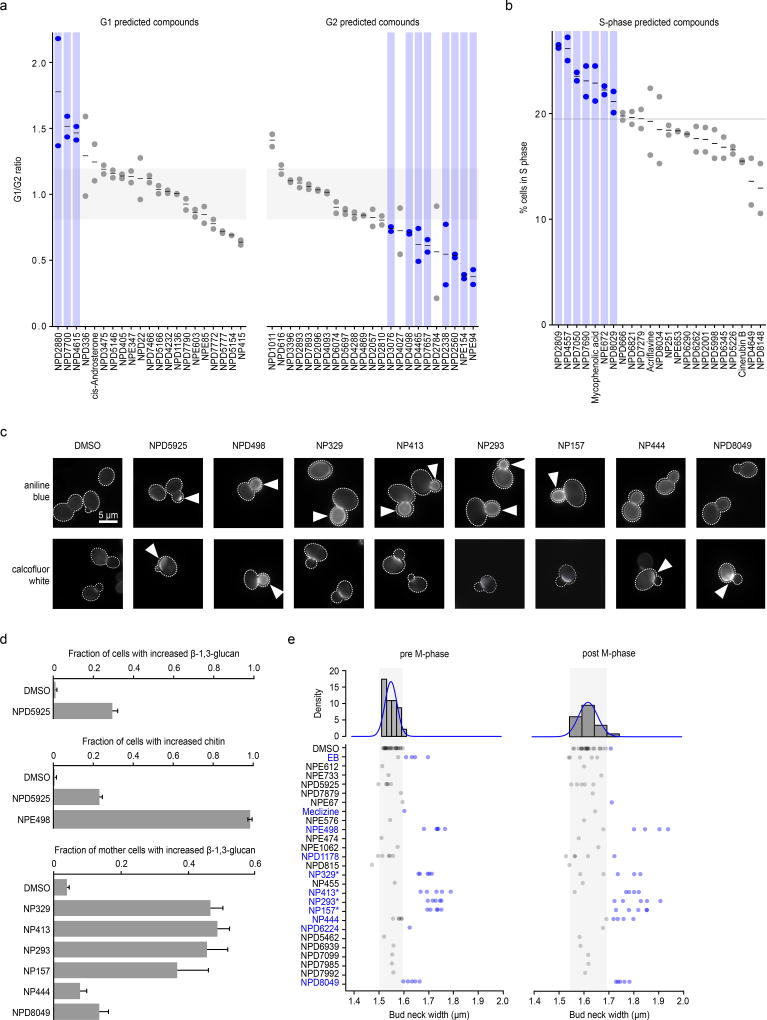
Figure 5. Large-scale validation of predicted target processes.
(a) Comparison of observed and predicted cell cycle arrest phenotypes induced by 67 high-confidence compounds. Observed phenotypes were derived from flow cytometry analysis and predicted phenotypes were generated by mapping biological process annotations of the 67 compounds from this study to cell cycle arrest phenotypes via Yu et al. 200635. Compounds that induced a G1 phase delay phenotype (G1/G2 ratio +1.5 standard deviations from the DMSO mean – above grey shaded box) or G2 phase delay phenotype (–1.5 standard deviations from the DMSO mean – below grey shaded box) are indicated (blue circles, n=2, biological replicates). (b) Compounds confirmed by flow cytometry analysis to cause defects in S phase progression (at least 1.5 standard deviations above the DMSO mean – above grey line) are indicated (blue circles, n=2 biological replicates). (c) β-1,3 glucan (AB=aniline blue) and chitin (CFW=calcofluor white) staining of cells treated with compounds predicted to affect the cell wall. Arrows indicate abnormal deposition of cell wall chitin or β-1,3 glucan. (d) Proportion of cells with increased β-1,3 glucan or chitin signal following treatment with predicted cell wall targeting compounds (n=3, mean ± S.E.). (e) Measurement of bud neck width in pre/post M-phase cells following treatment with 25 compounds predicted to target the cell wall (n=5). Blue text and circles indicate greater than average bud neck width. * denotes pseudojervine compounds.

