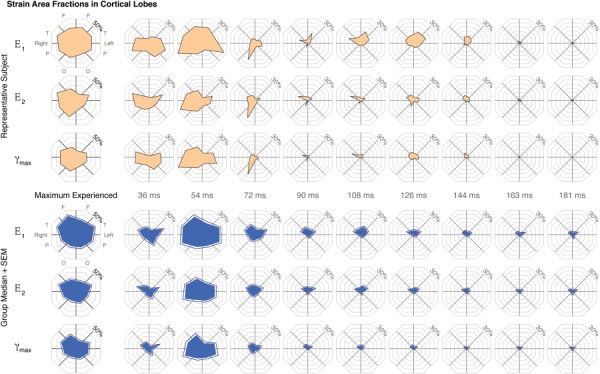
Fig. 5.

Area fractions of peak and by-frame maximum shear strain (γmax) in the cortical lobes were calculated at a 3% threshold for all subjects (n = 34). The representative and group median (+ standard error of the mean (SEM)) values plotted on a polar plot with octants representing the frontal (F), temporal (T), parietal (P), and occipital (O) lobes of left and right hemispheres.
