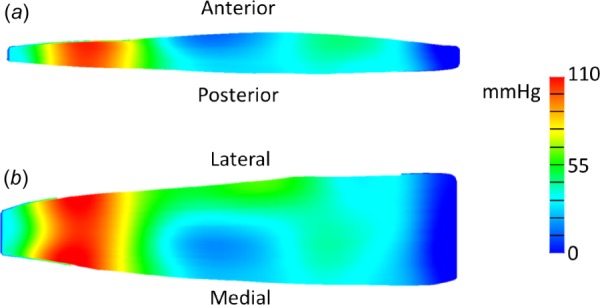
Fig. 3.

Color maps of fully activated finite element model at optimal length after one second of maximum contraction. (a) Image of two-dimensional sagittal midbelly slice of the model showing fluid pressure distribution. (b) Image of two-dimensional coronal midbelly slice showing fluid pressure distribution. The distal region exhibited the highest variability in fluid pressure.
