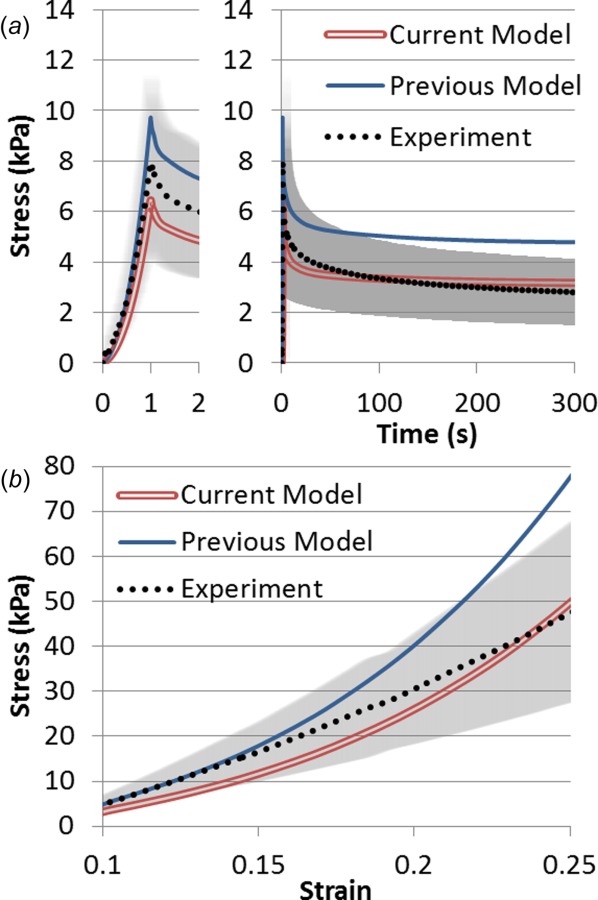
Fig. 4.

Comparison of two models to experimental data (mean with standard deviation in gray) of rabbit tibialis anterior muscle subject to transverse extension. The current model assumes a ξtrans value of 15 kPa while previous modeling utilized 33 kPa. (a) Stress relaxation step of 0.1 strain ramp (shown left) and 300 s of relaxation (shown right). (b) Constant rate pull to 0.25 strain at a rate of 0.01 s−1.
