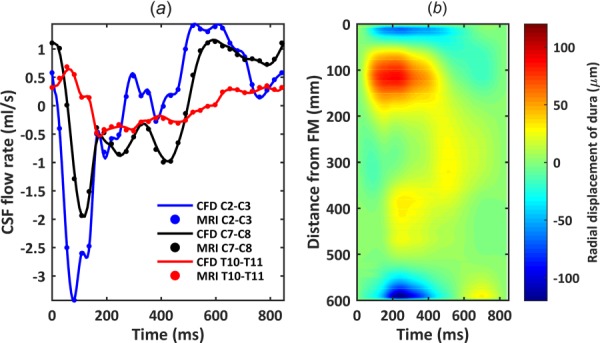
Fig. 3.

Comparison of numerical model axial flow rate distribution with subject specific PCMRI measurements: (a) CSF flow waveforms measured by PCMRI at three axial locations along the spine. Dots indicate experimental data and lines denote CFD results. Note: negative, or peak systolic, CSF flow is in the caudal direction. (b) Spatial–temporal distribution of the average dura radial displacement along the spine.
