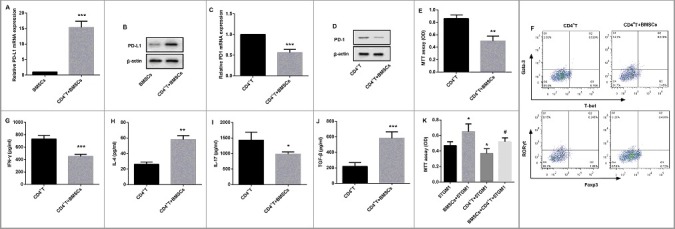
Figure 3.

Effects of BMSCs on CD4+ T cells and 5TGM1 proliferation. CD4+ T cells derived from spleens of C57BL/6 mice (n = 10) were isolated, and induced with LPS. Then these CD4+ T cells (1×10³, bottom) were transwell cocultured with BMSCs (1×10⁵, upper) for 24 h. (A) qRT-PCR and (B) Western blot were performed to evaluate relative mRNA and protein expression of PD-L1 in BMSCs respectively. ***P<0.001 vs. BMSCs. (C) qRT-PCR and (D) Western blot were performed to evaluate relative mRNA and protein expression of PD-1 in CD4+ T cells respectively. ***P<0.001 vs. CD4+ T cells. β-actin served as the loading control. (E) The proliferation of CD4+ T cells transwell cocultured with BMSCs was evaluated by MTT assay. (F) Flow cytometry was performed to examine the proportion of Th1 cells (T-bet+ CD4+ T cells, Q3), Th2 cells (Gata-3+ CD4+ T cells, Q1), Th17 cells (RORγt+ CD4+ T cells, Q1), and Treg cells (Foxp3+ CD4+ T cells, Q3) in CD4+ T cells with their special fluorescence-labeled mAbs. ELISA was used to detect the cytokine levels of (G) Th1-related IFN-γ, (H) Th2-related IL-4, (I) Th17-related IL-17, and (J) Treg-related TGF-β in the culture medium of CD4+ T cells. *P<0.05, **P<0.01,***P<0.001 vs. CD4+ T. (K) The proliferation of 5TGM1 cells (1×10³, bottom) transwell cocultured with either BMSCs (1×10⁵, upper) or CD4+ T cells (1×10³, upper), or the combination of 1×10⁵ BMSCs and 1×10³ CD4+ T cells (upper) was evaluated by MTT assay. Each experiment was performed at least three times. *P<0.05 vs. 5TGM1. #P<0.05 vs. CD4+ T + 5TGM1.
