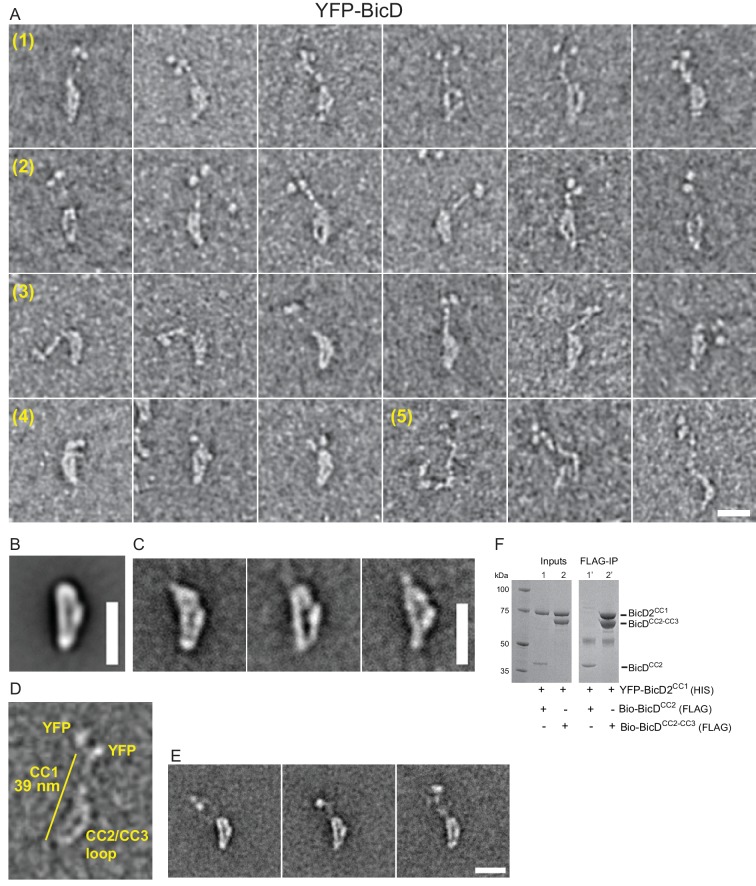
Figure 2. Electron micrographs of the auto-inhibited full-length YFP-BicD.
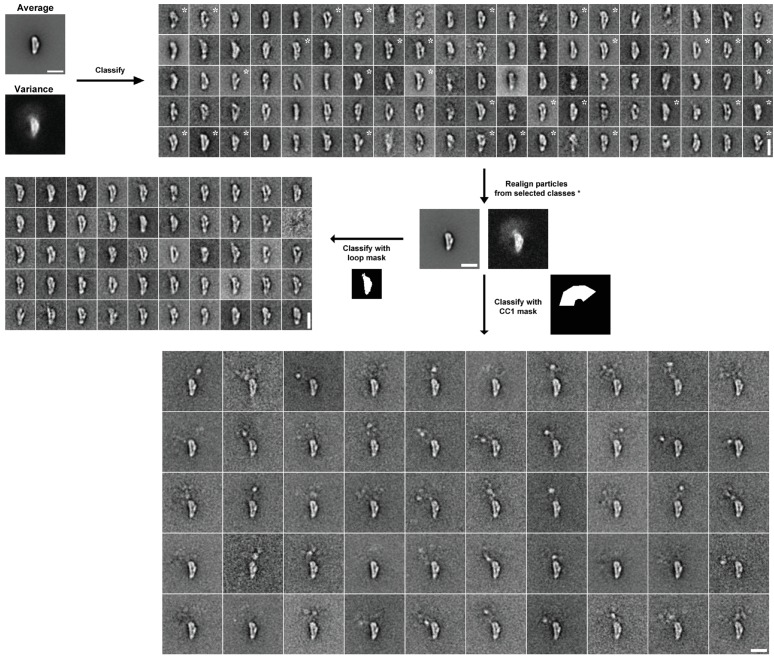
(A) A montage of negatively stained images showing (row 1) the most common ‘b’ orientation, (row 2) a less common ‘d’ orientation, (row 3) the range over which the molecule can flex, (row 4) compact molecules, and (row 5) rare open molecules. (B) Global average of all aligned YFP-BicD images. (C) Example class averages of BicD with classification focused on the loop. (D) One YFP-BicD molecule illustrating the interpretation of the EM image, with the length of the long straight section indicated. (E) Example class averages of YFP-BicD with classification focused on the protruding YFP-CC1 region. See Figure 2—figure supplement 1 for full classifications. (F) Pulldown showing that CC1 interacts with CC2-CC3 but not CC2. Scale bars = 20 nm.


