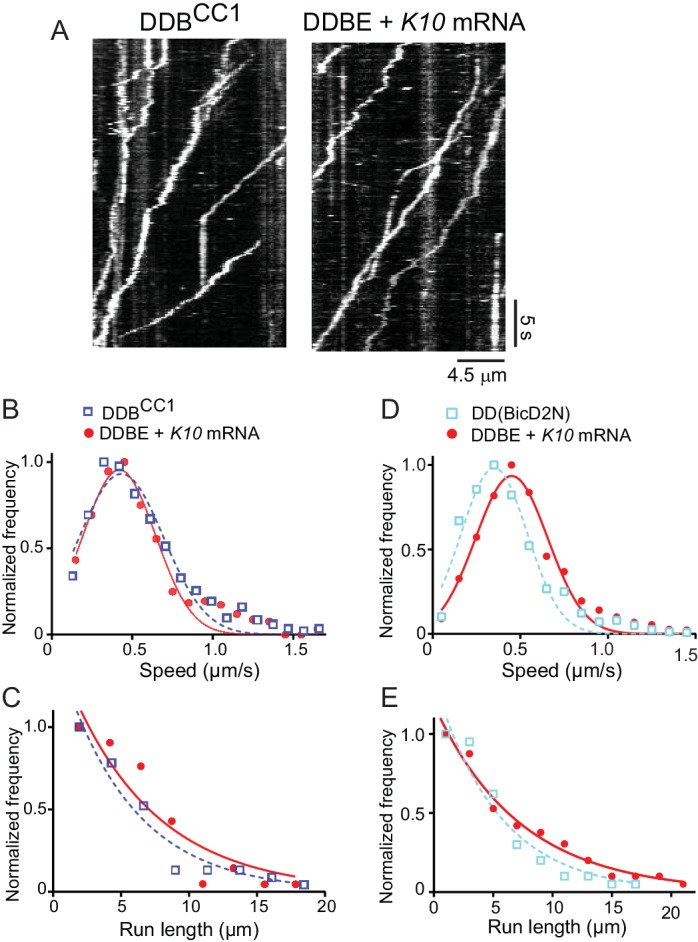
Figure 5. The motile properties of the fully reconstituted mRNP are similar to dynein-dynactin complexes reconstituted with Drosophila DDBCC1 or mammalian BicD2N.
(A) Kymograph of (left panel) a minimal dynein-dynactin-BicDCC1 (DDBCC1) complex, and (right panel) a complex of dynein, dynactin, full-length Drosophila BicD, Egl and K10 mRNA, visualized with a Qdot on BicD (B) Speed distributions of DDBE + K10 mRNA (red circles) (0.42 ± 0.22 μm/s, n = 505) and DDBCC1 (blue squares) (0.43 ± 0.26 μm/s, n = 516, p=0.25, t-test, mean ± SD). (C) Run length distributions of DDBE + K10 mRNA (red circles) (6.4 ± 0.25 μm, n = 71) and DDBCC1 (blue squares) (5.3 ± 0.17 μm, n = 66, p=0.8, Kolmogorov–Smirnov test, mean ±SE of the fit). (D) Speed distributions of DDBE + K10 mRNA (red circles) (0.45 ± 0.21 µm/s, n = 1126) and DD(BicD2N) (blue squares) (0.35 ± 0.19 µm/s, n = 1147; p<0.05, t-test, from 50 representative run trajectories for each condition, mean ± SD). (E) Run length distributions of DDBE + K10 mRNA (red circles) (7.2 ± 0.5 μm, n = 142) and DD(BicD2N) (blue squares) (5.4 ± 0.7 μm, n = 137, p=0.053, Kolmogorov–Smirnov test, mean ± SE of the fit). See Figure 5—source data 1.

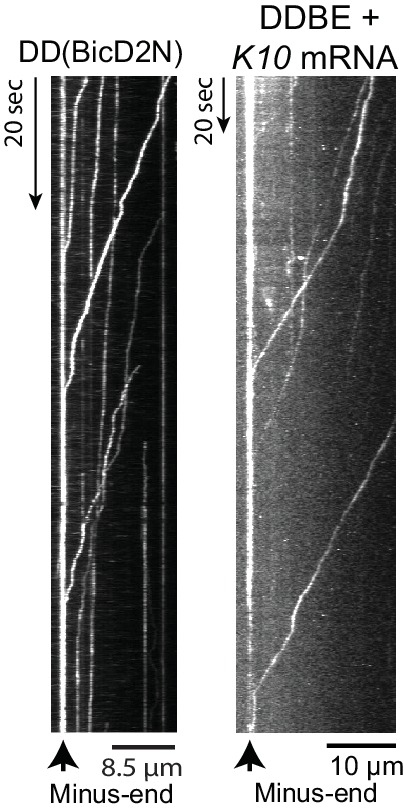
Figure 5—figure supplement 1. Kymograph of (left panel) a minimal dynein-dynactin-BicD2N complex, visualized with a Qdot bound to BicD2N, and (right panel), a complex of dynein, dynactin, full-length Drosophila BicD, Egl and K10 mRNA labeled with Alexa Fluor 488-UTP.

