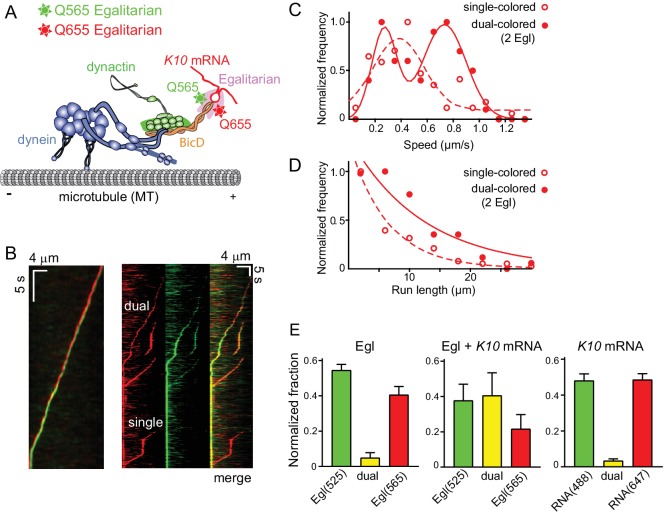
Figure 6. Motile properties of complexes containing one versus two Egl molecules.
(A) Schematic of the two-color experiment in which Egl is labeled with either a 565 or 655 nm QDot (figure adapted from [Reck-Peterson et al., 2018]). (B) Kymographs of dual-color runs. (Left panel) trajectories of a run with both a 565 nm (green) and a 655 nm (red) Qdot-labeled Egl bound to the moving complex. The red trajectory is shifted horizontally for presentation purposes. (Right panels) Red, green and combined channels of several processive runs. The top three trajectories are dual-color runs, while the bottom one is a single-color run. (C) Speeds of single-color complexes (open red circles) were best fit to a single Gaussian distribution with a speed of 0.38 ± 0.20 μm/s (n = 81). In contrast, the dual-colored complex (filled red circles) was best fit with a double Gaussian distribution with a slow speed of 0.27 ± 0.1 μm/s, and a faster speed of 0.73 ± 0.16 μm/s (n = 62). (D) Run length histogram of single-color events (open red circles) (6.4 ± 0.7 μm, n = 81) are significantly shorter than dual-color runs (filled red circles) (12.1 ± 2.4 μm, n = 62; p=0.045, Kolmogorov–Smirnov test, mean ± SE of the fit). The curves are exponential fits to the data. (E) Dual-colored Egl (525 or 565 Qdots), dual-colored Egl plus mRNA, or dual-colored mRNA (Alexa 488-UTP or Andy 647-UTP) mixed in solution and adhered to a glass coverslip. The percent single- and dual-colored complexes are indicated. After correction for complexes with two copies of the same color Egl (see Materials and methods), 83% of complexes were determined to contain two molecules of Egl. See Figure 6—source data 1.

