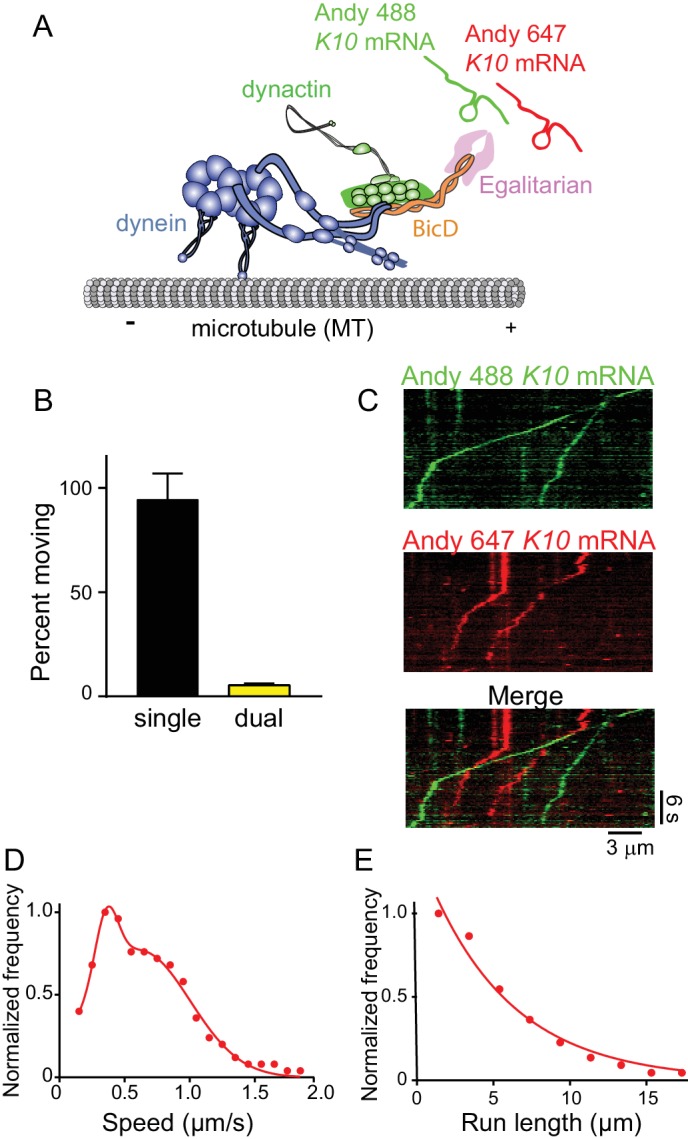
Figure 9. The mRNP predominantly contains one K10 mRNA.

(A) Schematic of the two-color mRNA experiment. mRNA was either labeled with Andy 488-UTP (green) or Andy 647-UTP (red) (figure adapted from [Reck-Peterson et al., 2018]). (B) 5.5% of moving complexes were dual-labeled, implying that 11% of the complexes contained 2 mRNAs, and 89% contained one mRNA. (C) Representative kymographs highlighting the predominance of single-colored moving complexes. (D) The speed pattern was bimodal (0.36 ± 0.09 μm/s and 0.62 ± 0.38 μm/s, n = 187) because the complex was reconstituted with two dyneins per dynactin. (E) Run lengths were 5.5 ± 0.09 μm (n = 67). See Figure 9—source data 1.
