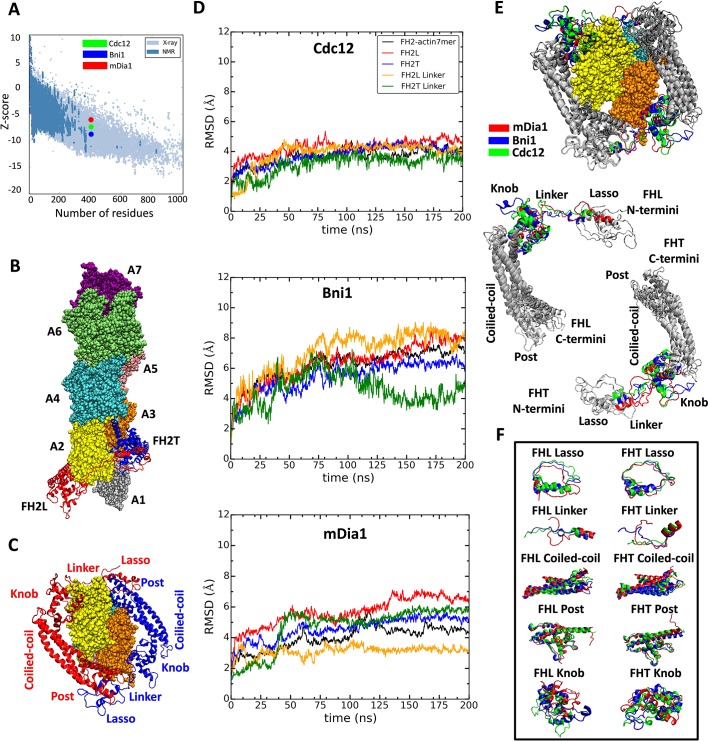
Figure 2. Homology models of FH2 domains on the barbed end of actin filaments.
(A) Overall quality of the homology models of Cdc12, Bni1 and mDia1 FH2 domains after 200 ns of MD simulations. The graph compares the z-scores of the three homology models with the z-scores of all experimentally determined native proteins from Protein Data Bank. (B, C) Ribbon diagrams of a dimer of Cdc12 FH2 domains interacting with the barbed end of a space-filling model of an actin filament seven-mer in the state before the formin steps onto the newly added actin subunit A1 on the barbed end. The actin subunits are numbered from A1 to A7, starting from the barbed end. (B) Side view. (C) View from the barbed end without subunit A1 and with labels on the regions of FH2 domains. (D) The root mean square deviations (RMSD) of C-alpha atoms over time during the all-atom MD simulations of dimers of FH2 domains of Cdc12, Bni1 and mDia1 on an actin seven-mer. The first 160 ns of the trajectory for Bni1 is from Baker et al. (2015). The trajectories of the whole complex, FH2 domains and linkers are displayed in different colors. (E, F) Structural alignment of ribbon diagrams taken at the end of 200 ns all-atom simulations of the FH2 domains of Bni1, Cdc12 and mDia1 associated with the actin filament seven-mer. Structural features are labeled. (E) Views from the barbed end with actin subunits A2 and A3 in the upper panel. The FHL and FHT domains are shown separately by aligning the coiled-coil regions in the lower panel. Superimposed features are shown in gray and features that differ between the three formins are color-coded. The actin filaments are not aligned and only shown to guide the location of formins. (F) The superimposed ribbon diagrams of the separate parts of the FH2 domains of the three formins.

