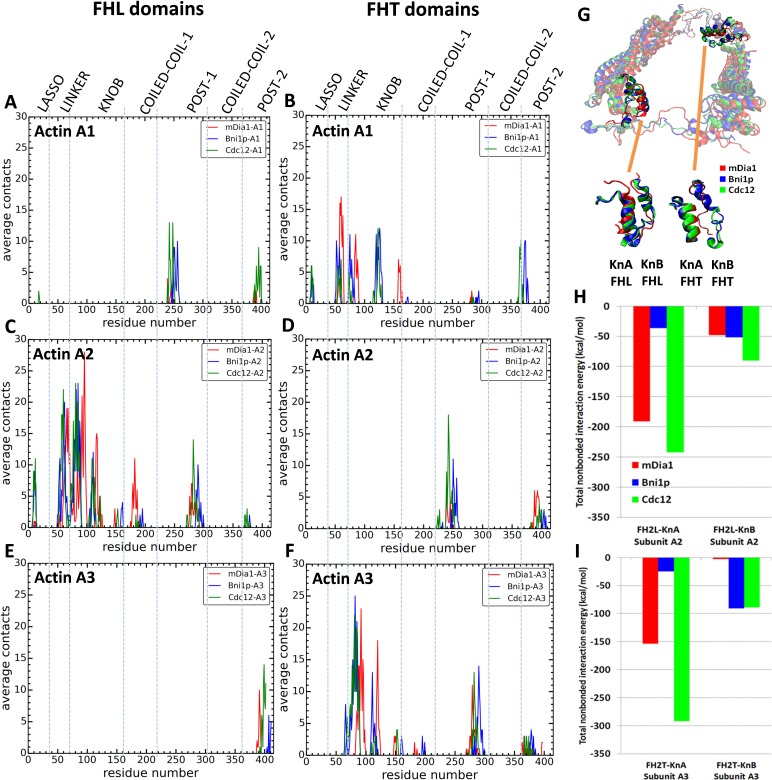
Figure 7. Interactions of FH2 domains with actin filament seven-mers.
The time-averaged number of contacts over the last 20 ns of the 200 ns simulations between the three actin subunits at the barbed ends of the filaments and the FH2 domains of mDia1 (red), Bni1 (blue) and Cdc12 (green). The actin subunits are numbered from 1 to 3, starting with the newly added A1 subunit. (A, B) A1 actin subunits; (C, D) A2 actin subunits; and (E, F) A3 actin subunits. (A, C, E) show the contacts of the FHL domains and (B, D, F) show the contacts of the FHT domains. A pair of residues was considered to be in contact if the distance between their C-alpha atoms was ≤12 Å. (G) View from the pointed end of the structural alignment of FH2 domains taken from the end of 200 ns all-atom simulations of Bni1, Cdc12 and mDia1 FH2 domains interacting with an actin filament seven-mer. The orange lines point to the knA and knB helices of mDia1, Cdc12 and Bni1 FH2 domains. (H, I) Total nonbonded interaction energy (sum of van der Waals and electrostatic interactions) between (H) FHL (leading) and (I) FHT (trailing) knob helices of mDia1, Bni1, Cdc12 formins and the barbed end of actin subunits A2 and A3.


