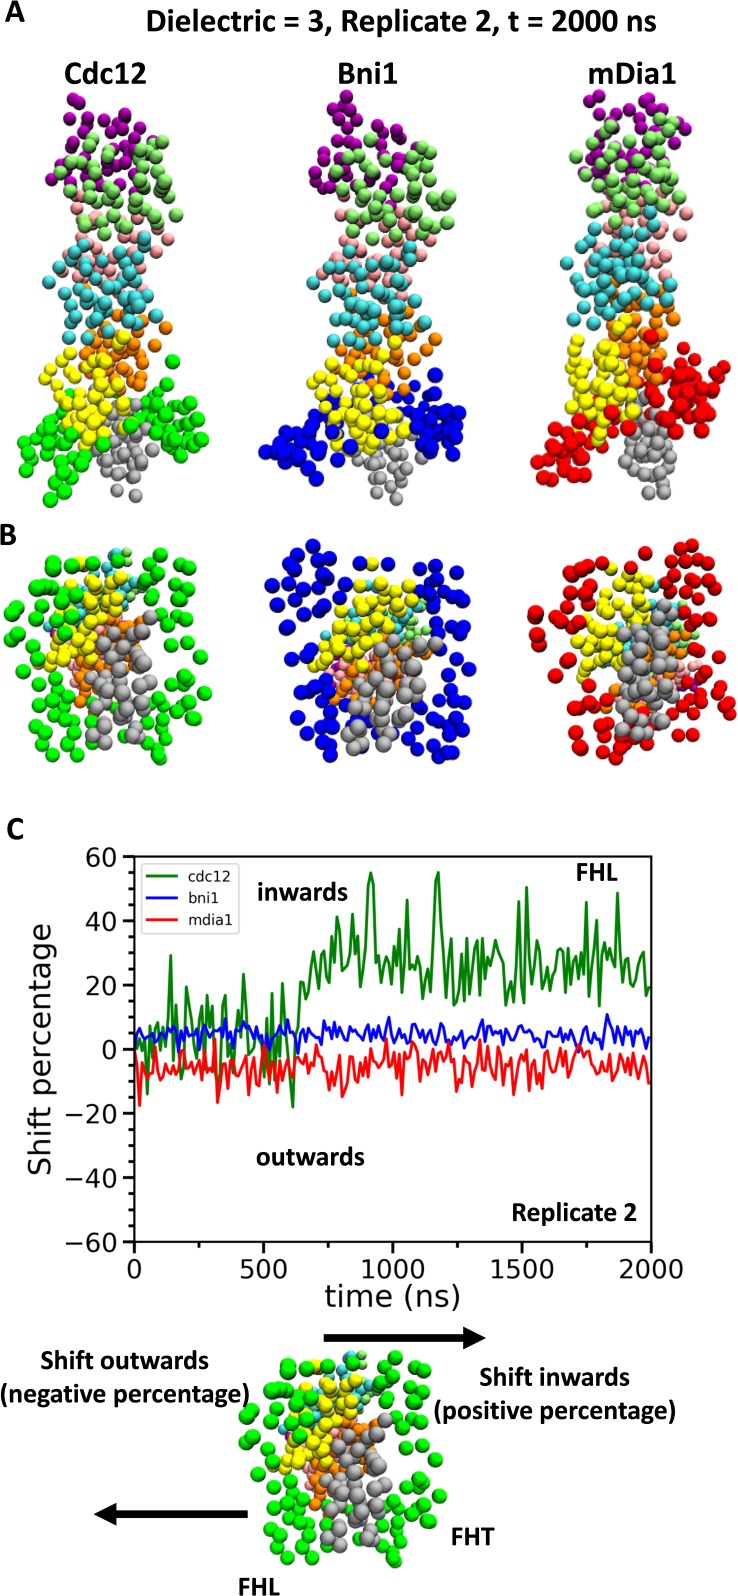
Figure 9. Conformational changes of FH2 domains on the barbed ends of actin filament seven-mers during coarse-grained (CG) simulations.
(A) Side and (B) bottom views of structures of Cdc12, Bni1, and mDia1 FH2 domains interacting with the barbed ends of actin filaments at the end (t = 2000 ns) of the CG simulations (dielectric constant of 3, replicate 2). (C) Time courses of the center-of-mass displacements of FHL domains from their initial positions (shown as percentage change) in the direction perpendicular to the long axis of the actin filaments. A positive percentage indicates a shift towards the actin filament (favors the ‘closed’ state), whereas a negative percentage indicates a shift away from the actin filament (favors the ‘open’ state). The shifting of a representative FHL domain in two different directions is schematically shown at the bottom.

