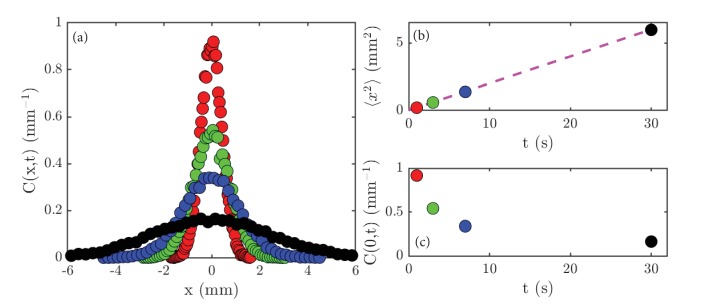
Figure 2. Experimental results on diffusion in a population of the green alga Chlamydomonas.
(a) Concentration profiles, , normalized to unity, at the following times: 1 second (red), 3 seconds (green), 7 seconds (blue) and 30 seconds (black). (b) The variance, , of the data shown in (a) as a function of time; the dashed magenta line is a linear fit to the data. (c) The peak height, , of the data shown in (a) as a function of time.

