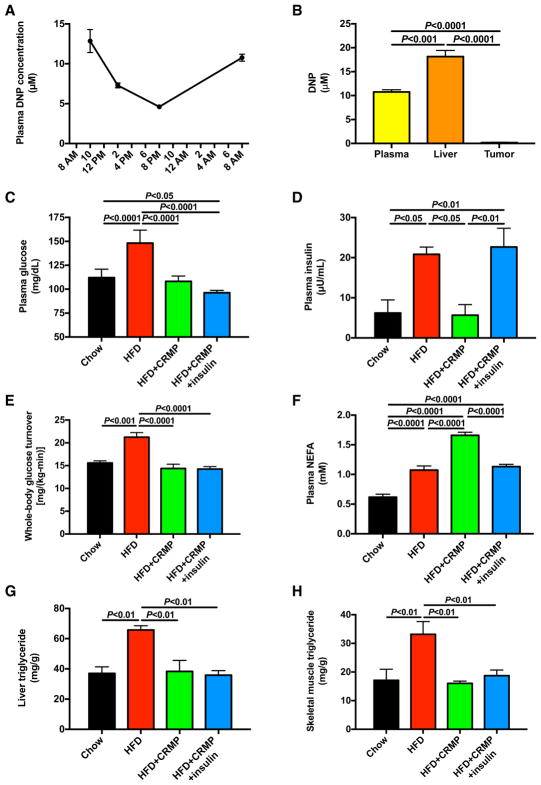
Figure 1. Liver-Targeted Mitochondrial Uncoupling with a Controlled-Release Mitochondrial Protonophore Reverses Fasting Hyperglycemia and Hyperinsulinemia in HFD MC38 Tumor-Bearing Mice.
(A) Plasma DNP concentration in tumor-bearing mice given ad lib access to food containing controlled-release mitochondrial protonophore.
(B) Plasma, liver, and tumor DNP concentrations measured in a separate group of ad lib-fed mice at 10 a.m.
(C and D) Fasting plasma glucose (C) and insulin concentrations (D).
(E) Endogenous glucose production.
(F) Plasma non-esterified fatty acid concentrations.
(G and H) Liver (G) and quadriceps (H) triglyceride content
In (A) and (B), n = 4. In (C)–(H), n = 7 HFD mice and 8 in all other groups. Data are the mean ± SEM, with comparisons by ANOVA with Bonferroni’s multiple comparisons test. See also Figure S1.

