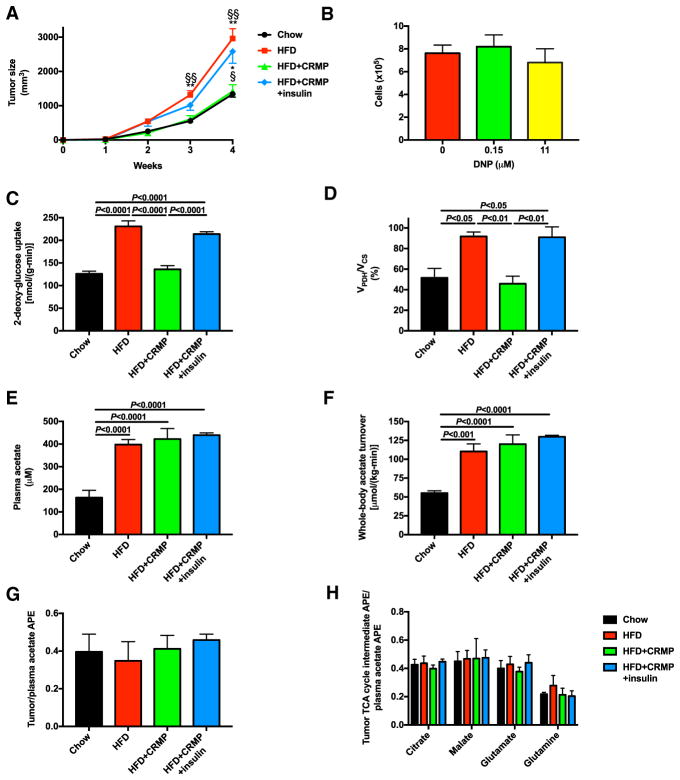
Figure 2. Controlled-Release Mitochondrial Protonophore Slows MC38 Tumor Growth and Limits Tumor Glucose Uptake and Oxidation due to Reversal of Hyperinsulinemia.
(A) Tumor size.
(B) In vitro proliferation of cells incubated in media containing DNP. Data are the mean ± SEM of 6 replicate wells for each condition, each counted in duplicate. The two conditions were compared by the two-tailed unpaired Student’s t test.
(C and D) Tumor glucose uptake (C) and oxidation (VPDH/VCS) (D).
(E and F) Plasma acetate concentrations (E) and whole-body acetate turnover (F).
(G) Ratio of tumor to plasma acetate enrichment in mice infused with [1-13C] acetate.
(H) Ratio of tumor TCA cycle intermediate enrichment to plasma acetate enrichment in mice infused with [1-13C] acetate.
In (A) and (C)–(H), n = 7 HFD mice and 8 in all other groups. In all panels, data are the mean ± SEM with comparisons by ANOVA with Bonferroni’s multiple comparisons test unless otherwise stated.

