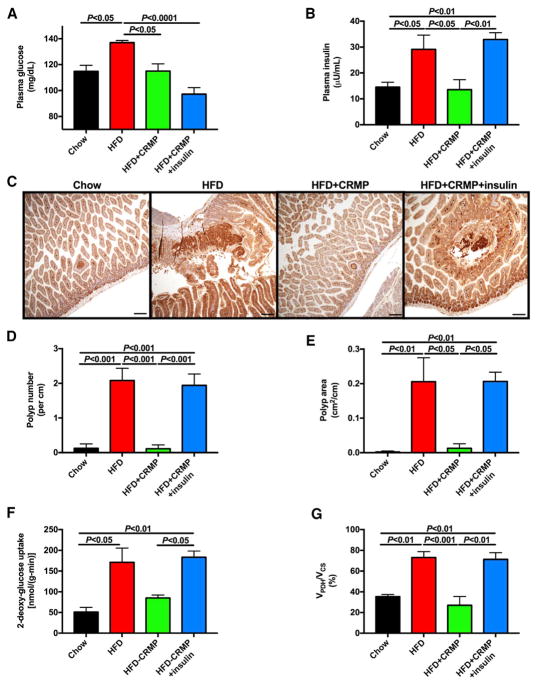
Figure 3. Controlled-Release Mitochondrial Protonophore Slows Tumor Growth in High-Fat-Fed ApcMin+/− Mice, a Murine Model of Familial Adenomatous Polyposis, by Reversing Hyperinsulinemia.
(A and B) Fasting plasma glucose (A) and insulin concentrations (B).
(C) Representative images of small intestine stained for β-catenin.
(D and E) Quantification of total polyp number (D) and area (E).
(F and G) Tumor glucose uptake (F) and oxidation (VPDH/VCS) (G).
In (A)–(E), n = 5 per group. In (F) and (G), n = 4–5 per group. In all panels, data are the mean ± SEM and groups were compared by ANOVA with Bonferroni’s multiple comparisons test. See also Figure S2.

