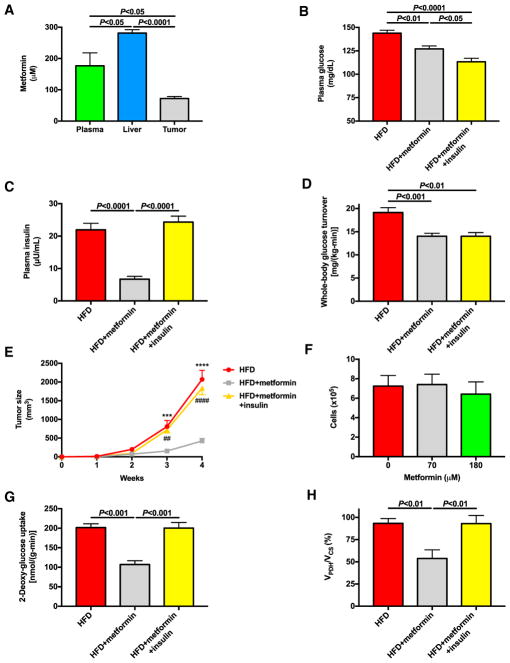
Figure 4. Metformin Slows Tumor Growth in HFD Mice by Reducing Tumor Glucose Uptake and Oxidation Secondary to Hyperinsulinemia.
(A) Plasma, liver, and tumor metformin concentrations.
(B and C) Fasting plasma glucose (B) and insulin concentrations (C).
(D) Endogenous glucose turnover.
(E) Tumor size.
(F) In vitro proliferation of MC38 cells incubated in media containing metformin.
(G and H) Tumor glucose uptake (G) and oxidation (VPDH/VCS) (H).
In (A), n = 6. In (B)–(H), data are the mean ± SEM of n = 8 per group, with comparisons by ANOVA with Bonferroni’s multiple comparisons test. See also Figure S3.

