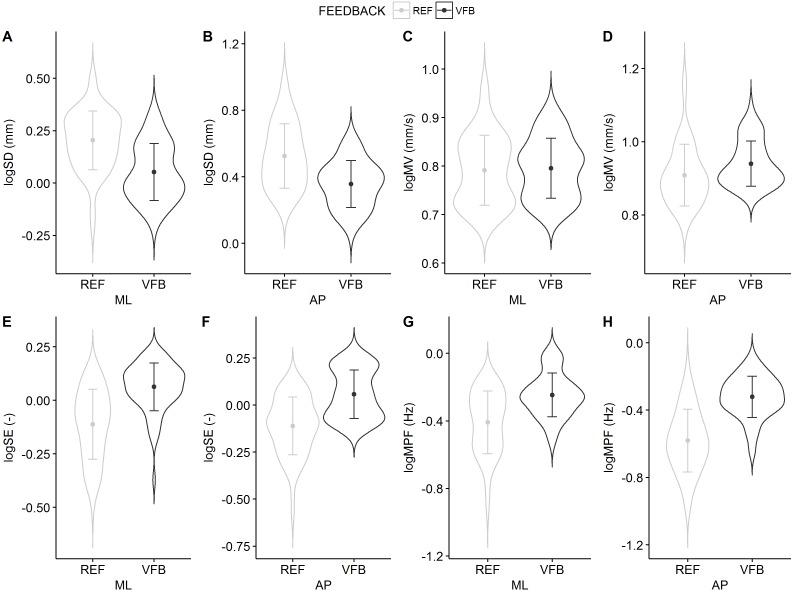
Figure 2. Violin plots of the COP parameters for the REF and the VFB conditions collapsed over trials with and mean ± standard deviations superimposed: SD, variability; MV, mean speed; SE, sample entropy; MPF, mean power frequency.
These plots show full distribution of the data obtained by kernel density estimation. The dot symbol denotes mean, whisker denotes standard deviation.

