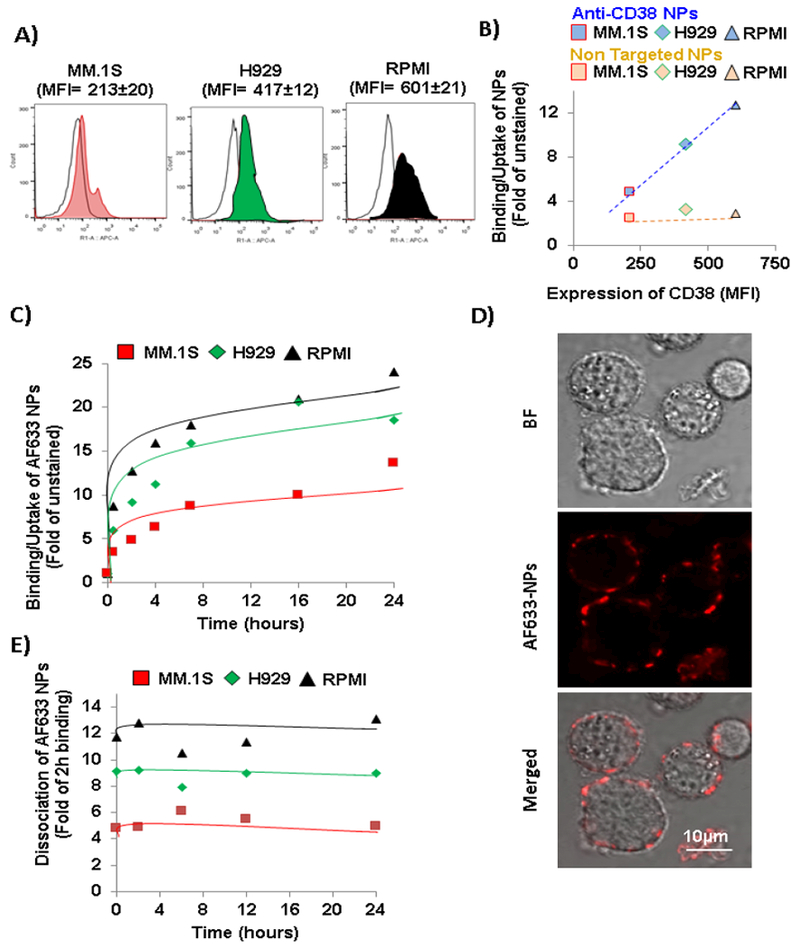
Fig. 3:

Kinetics of binding/uptake of anti-CD38 chitosan NPs to MM cells. A) Flow cytometry representative histograms of CD38 expression measured as fold of MFI of anti-CD38 to isotype controls in MM cells. B) Correlation of anti-CD38 NPs binding/uptake at 2 h with CD38 expression in MM cells compared to the non-correlation of non-targeted NPs with CD38 expression. C) Kinetics of binding/uptake of anti-CD38 chitosan NPs over a period of time of 24 h to MM cells. D) Fluorescent imaging of AF633 anti-CD38 chitosan NPs after 2 h of binding/uptake to MM1s cells (Bright field (BF); AF633, Red). Scale bar= 10 μm. E) Kinetics of dissociation of anti-CD38 chitosan NPs over a period of time of 24 h to MM cells after 2 h of binding/uptake.
