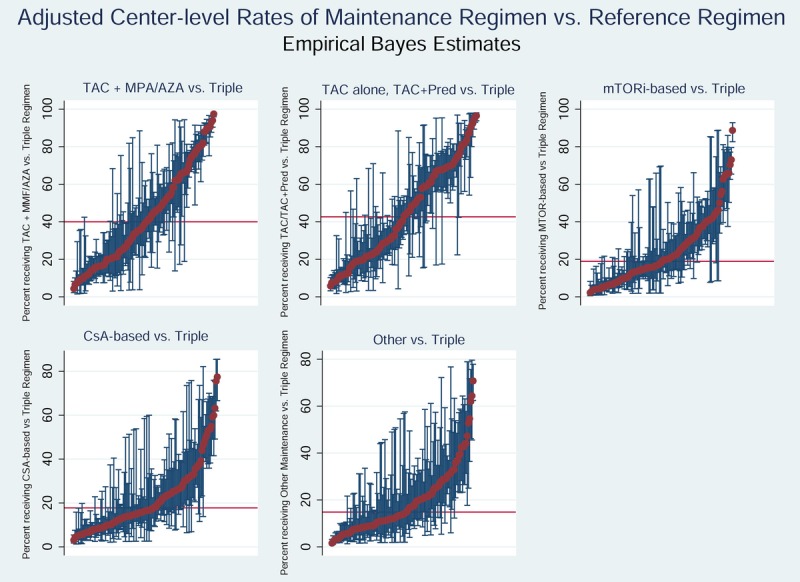
FIGURE 2.

Empirical Bayes estimates for likelihood of use of each maintenance ISx regimen compared with triple therapy in months 0 to 6 after liver transplant. The red bar demonstrates the national average rate of use of each regimen (within pairwise regimen comparisons). Each red dot represents adjusted use at one center, and the blue bars reflect 95% CIs for use at the center determined by EBEs, adjusting for case factors of transplants at the center; exclusion of the national average by a 95% CI reflects adjusted center use significantly above or below the national average.
