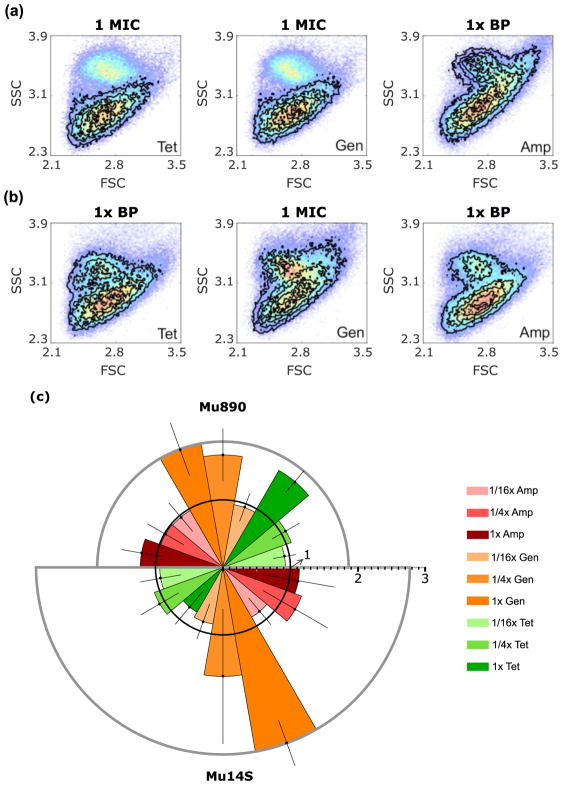
Figure 2. FAST antibiotic-induced scatter signals for E. coli isolates Mu890 and Mu14S.
(a and b) Antibiotic induced scatter histograms (black contours) overlaid on paired no-antibiotic control (color dots, red indicating highest occurrence). BP: break point. (a) Mu890 treated with tetracycline (Tet) at 1 μg/mL (MIC), gentamicin (Gen) at 8 μg/mL (MIC). and ampicillin (Amp) at 32 μg/mL (resistance breakpoint). (b) Mu14S treated with tetracycline at 16 μg/mL (resistance breakpoint), gentamicin at 8 μg/mL (MIC) and ampicillin at 32 μg/mL (resistance breakpoint). (c) PB-sQF distances for (a) and (b). The radius is the fold distance, (the test statistics normalized by the 99% confidence distance to be different from the control). The 99% confidence fold-distance is represented by the inner black circle with radius equal to 1. Any test result exceeding the 99% confidence level (error bar included) is statistically different from the control and is an effective antibiotic treatment. Mu890 results: upper semicircle. Mu14S results: lower semicircle. Error bar is one standard deviation above and below the average fold distance obtained from triplicate trials. Details of test statistics and error bar calculation are presented in the Methods.

