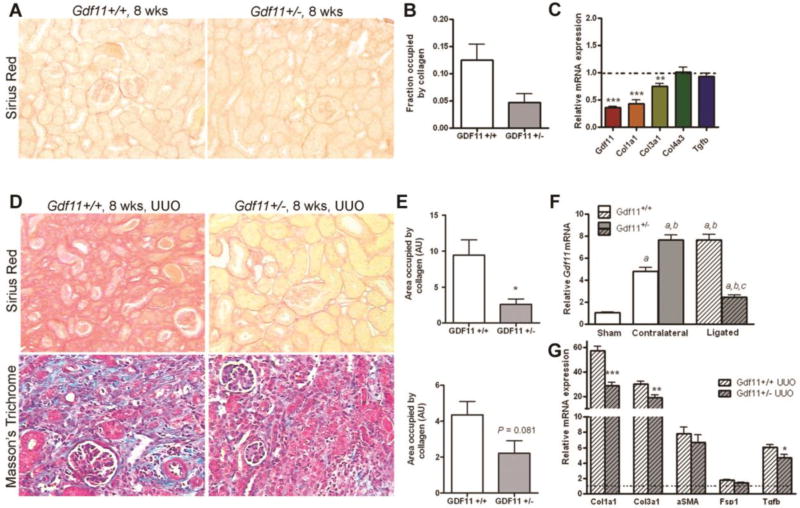
Figure 6. Reduced fibrosis in normal and ligated Gdf11+/− kidneys.
(A). Representative images and (B) quantification of Sirius Red collagen staining of kidney sections from 8-week-old Gdf11+/+ and Gdf11+/− mice. (C) QPCR analysis of Gdf11, Col1a1, Col3a1, Col4a3, and Tgfb1 expression in 8-week-old Gdf11+/+ and Gdf11+/− mice (n = 4 per group). (D) Representative images and (E) quantification of Sirius Red collagen staining and Masson’s Trichrome staining of ligated kidneys 14 d after unilateral ureteric obstruction (UUO) in 8-week-old Gdf11+/+ and Gdf11+/− mice. (F) QPCR analysis of Gdf11 mRNA induction in ligated and contralateral (non-ligated) kidneys from 8-week-old Gdf11+/− and Gdf11+/+ mice after UUO. (G) QPCR analysis of Col1a1, Col3a1, Tgfb1, Acta2, and Fsp1 expression in the ligated kidneys of Gdf11+/+ and Gdf11+/− mice after UUO (n = 4 per group). *P < 0.05, **P < 0.01, ***P < 0.001

