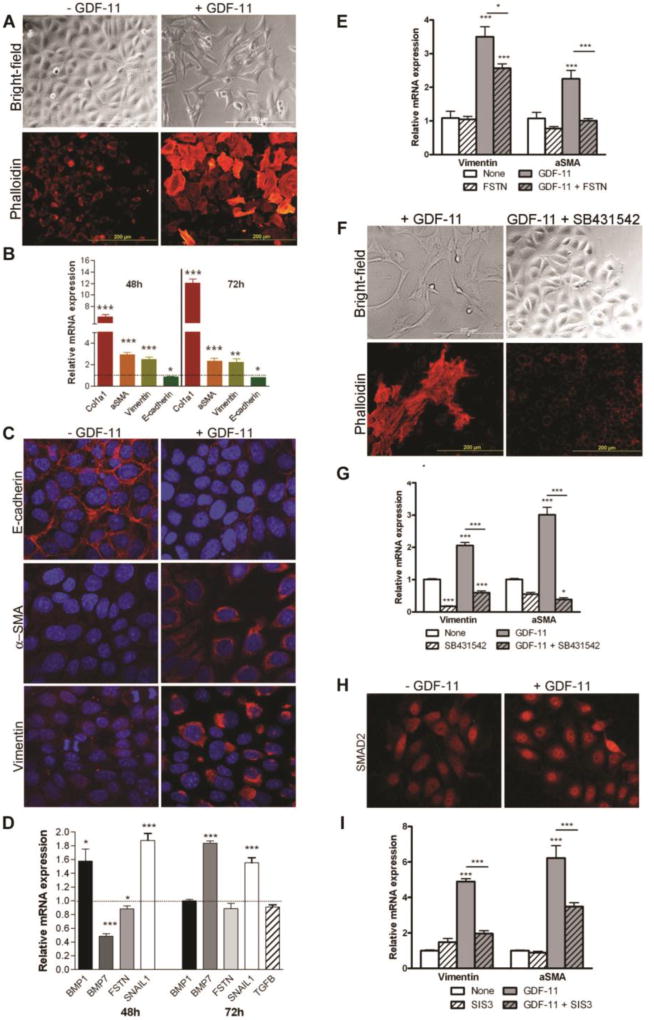
Figure 8. Exogenous GDF11 induces epithelial-to-mesenchymal transition in murine intramedullary collecting duct cells.
(A) Bright-field images of IMCD-3 cells after 72 hours of growth on plastic culture dishes, and phalloidin staining showing formation of stress fibers and altered morphology in IMCD-3 cells after 48 h of growth on chamber slides. Cells were either not treated or treated with 50 ng/mL recombinant GDF11. (B) QPCR analysis of Col1a1, Acta2, Vim, and Cdh1 expression in IMCD-3 cells treated with 50 ng/mL recombinant GDF11 for 48 h or 72 h. Results are normalized to Gapdh and expressed relative to control-treated cells. (C) Confocal micrographs of IMCD-3 cells treated with control or 50 ng/mL recombinant GDF11 for 96 h and immunofluorescently stained for E-cadherin (top panel), αSMA (middle panel), and vimentin (bottom panel) (all red) and counterstained with DAPI (blue). (D) QPCR analysis of Snail1, Tgfb, Bmp1, Bmp7, and Fstn mRNA in IMCD-3 cells treated with GDF11 for 48 h or 72 h. (E) qRT-PCR analysis of vimentin and αSMA expression in control IMCD-3 cells or those treated with follistatin (FSTN) and/or GDF11. (F) Bright-field and phalloidin-stained images of morphological changes in IMCD-3 cells after treatment with GDF11 and/or the ALK5 inhibitor SB431542. (G) QPCR analysis of Vim and αSma expression in control IMCD-3 cells or those treated with GDF11 and/or SB431542. (H) Nuclear localization of SMAD2 by indirect immunofluorescence staining of IMCD-3 cells starved for 18 h and then stimulated with 50 ng/ml GDF11 or control for 30 min. (I) qRT-PCR analysis of Vim and αSma expression in control IMCD-3 cells or those treated with GDF11 and/or the SMAD3 inhibitor SIS3. All qRT-PCR results are normalized to Gapdh and expressed relative to control-treated cells. *P < 0.05, **P < 0.01, ***P < 0.001

