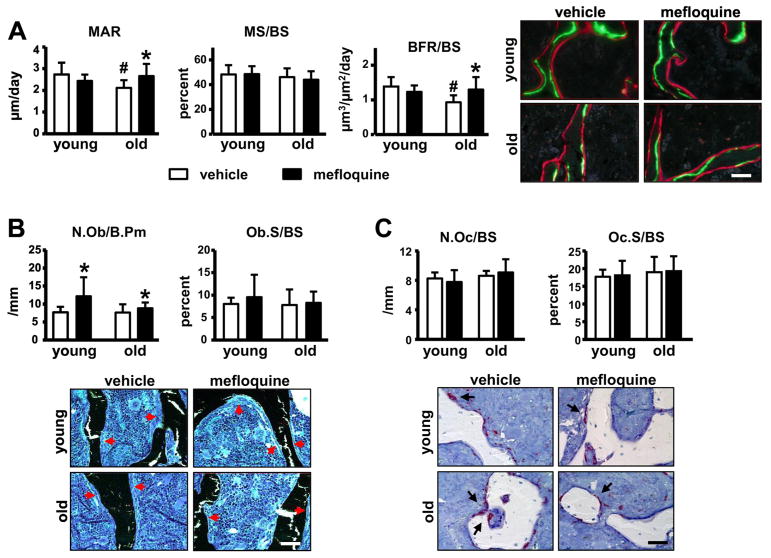
Fig. 2. Mefloquine administration reverses the decrease in bone formation induced by aging.
(A) MAR, MS/BS, and BFR/BS were measure in unstained sections of lumbar vertebra (n=7–10). (B) N.Ob/BS and Ob.S/BS were scored in lumbar vertebra stained with von Kossa/McNeal (n=7–10). (C) N.Oc/BS, Oc.S/BS, and ES/BS were scored in lumbar vertebra stained for TRAPase/Toluidine blue (n=7–8) in young and old mice. Bars represent mean ± s.d., #p<0.05 versus vehicle-treated young mice; *p<0.05 versus vehicle treated mice at the same age, by two-way ANOVA. Representative images from lumbar vertebra sections for the corresponding analysis are shown (red arrows; osteoblasts and black arrows; osteoclasts). All scale bars indicate 50μm.

