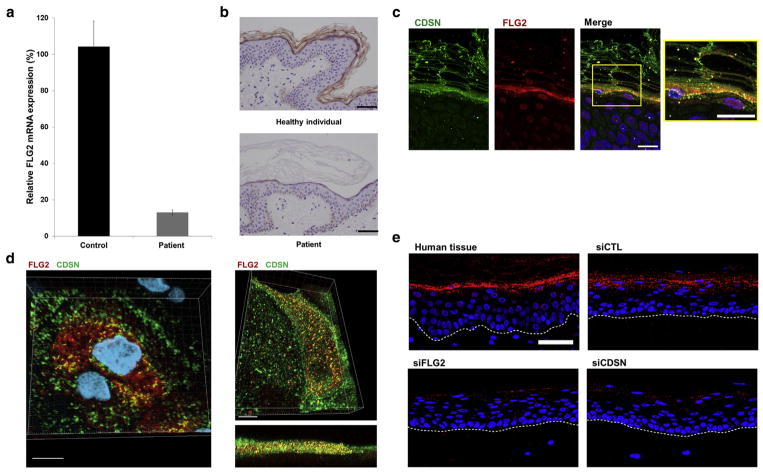
Figure 3. FLG2 RNA and protein level in the epidermis.
(a) Real-time PCR analysis was used to assess FLG2 RNA expression in cDNA derived from keratinocytes from two healthy individuals (Control) and patient II-7 (Patient). Results are expressed as percentage of RNA expression relative to expression in control samples ± standard error of the mean. (b) Skin biopsies from a healthy individual (Supplementary Table S5 online; upper panel) and from patient II-8 (inferior panel) were stained with an anti-filaggrin 2-specific antibody (scale bar =50 μm). (c) Filaggrin 2 and corneodesmosin (CDSN) partially colocalize in the lower cornified cell layers (scale bars = 20 μm). (d) Filaggrin 2 and CDSN colocalize in skin section (left panel) and in keratinocytes culture (right panel) by confocal microscopy (three-dimensional image analysis; scale bars = 10 μm). (e) Proximity ligation assay was performed using antibodies directed against CDSN and filaggrin 2 and biopsies from healthy human skin (upper-left panel) or from three-dimensional keratinocyte cultures transfected with control siRNA (upper-right panel, siCTL); FLG2-specific siRNA (lower-left panel, siFLG2); or CDSN-specific siRNA (lower-right panel, siCDSN). Colocalization produces a red fluorescent spot (scale bar = 50 μm).

