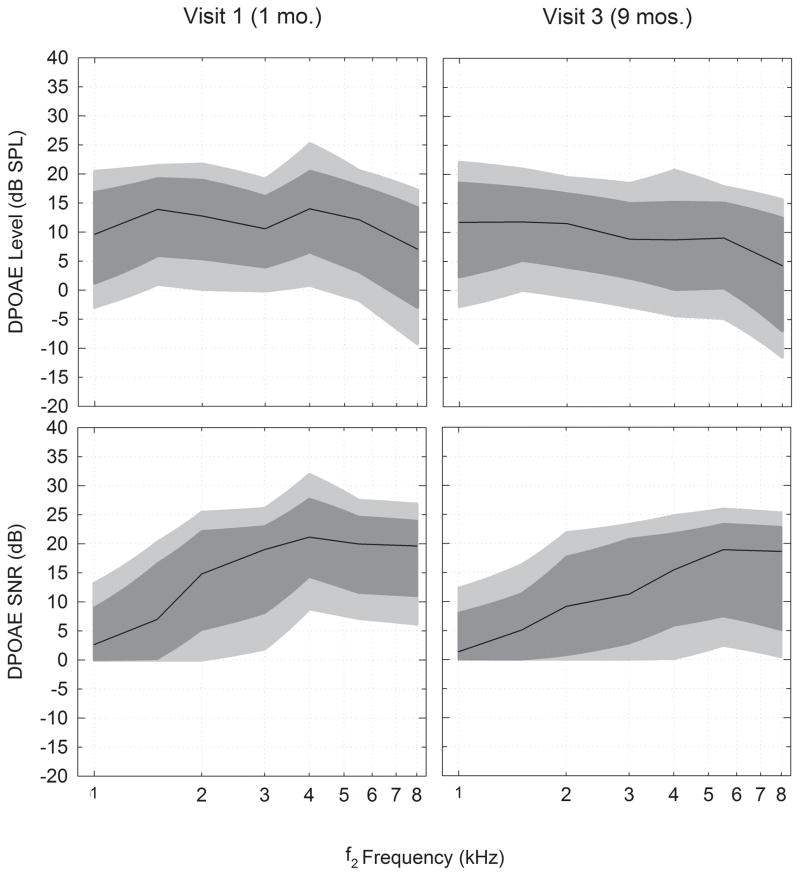
Figure 2.
Illustrates the raw data for DPOAE level and SNR distributions based on percentile rankings from normal-hearing infants in younger and older age groups. The light shaded area represents the 10th to the 90th percentile and the dark shaded area represents the 20th to 80th percentile. The dark black line represents the median or 50th percentile. The percentiles used in this figure are reported in Table 4.

