Figure 1.
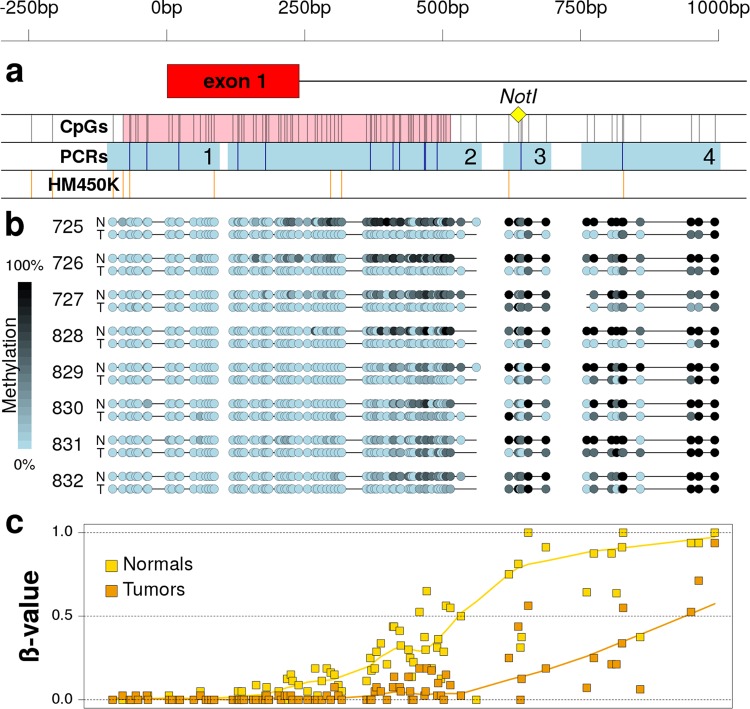
Methylation of the 5′-associated region of VWA2 in normal and tumor tissues of CRC patients. The scale on top is valid for the three panels and refers to the distance (in bp) to the VWA2 transcriptional start site. Panel a: Scheme of the DNA region containing the first exon of VWA2 (exon 1, in red). The yellow diamond indicates the location of the NotI site originally found hypomethylated by the MS-AFLP analyses. The first track (CpGs) shows the CpG sites (black vertical bars) and the promoter-associated CpG island (in pink). The second track (PCRs) shows the four products analyzed by bisulfite-based PCR (light blue squares) and the BstUI sites studied by COBRA (dark blue vertical bars). The third track (HM450K) indicates the position of the 10 probes of the Illumina HM450K methylation arrays within this region. Panel b: methylation status in normal (N) and tumor (T) tissues from CRC patients 725, 726, 727, 828, 829, 830, 831 and 832. Methylation was estimated by direct Sanger’s sequencing of the four PCR products shown in panel a. Panel c: average methylation level of normal (yellow) and tumor (orange) tissues from the eight patients shown in panel b, at every CpG site within the studied region. The solid lines represent the locally weighted moving average.

