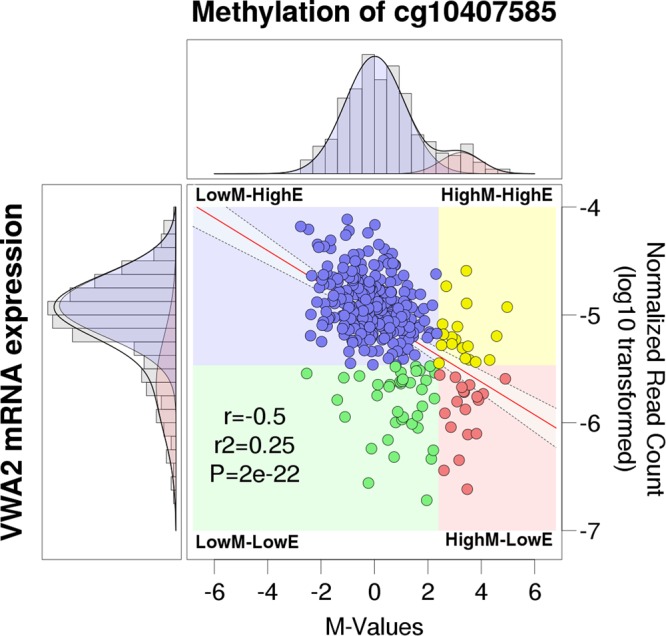
Figure 4.

Correlation between methylation of probe cg10407585 and VWA2 mRNA expression in 348 CRC tumors from the TCGA. In the central dot plot, methylation is represented as M-values in the x-axis. M-values of -2 and 2 correspond to ß-values of 0.2 and 0.8, commonly considered thresholds for demethylation and full methylation, respectively. VWA2 mRNA expression is represented in the y-axis, as the log10 transformation of the normalized read counts. The regression line is in red, with the 95% confidence interval of the slope represented by the shaded area between the dashed lines. The Pearson’s product-moment correlation coefficient (r), the coefficient of determination (r2) and the P-value (P) after correction for multi-hypothesis testing are indicated. In the density graphs of the M-values (top) and log10-transformed normalized read counts (left), grey bars represent the histograms of the observed distributions. The solid black lines represent the expected density of fitted Gaussian mixture models (see Supplementary Fig. S5). For methylation (top), the model yielded a large group (89%, shaded in blue) with low to intermediate levels of methylation, and a smaller group (11%, shaded in pink) with high levels of methylation. For expression, the model yielded a large group (78%, shaded in blue) with higher expression and a small group (21%, shaded in pink) with lower expression. Combining both binary classifications, cases were divided into low methylation – high expression (LowM-HighE, 77.87%, blue dots), high methylation – high expression (HighM-HighE, 5.46%, yellow dots), low methylation – low expression (LowM-LowE, 11.21%, green dots) and high methylation – low expression (HighM-LowE, 5.46%, pink dots).
