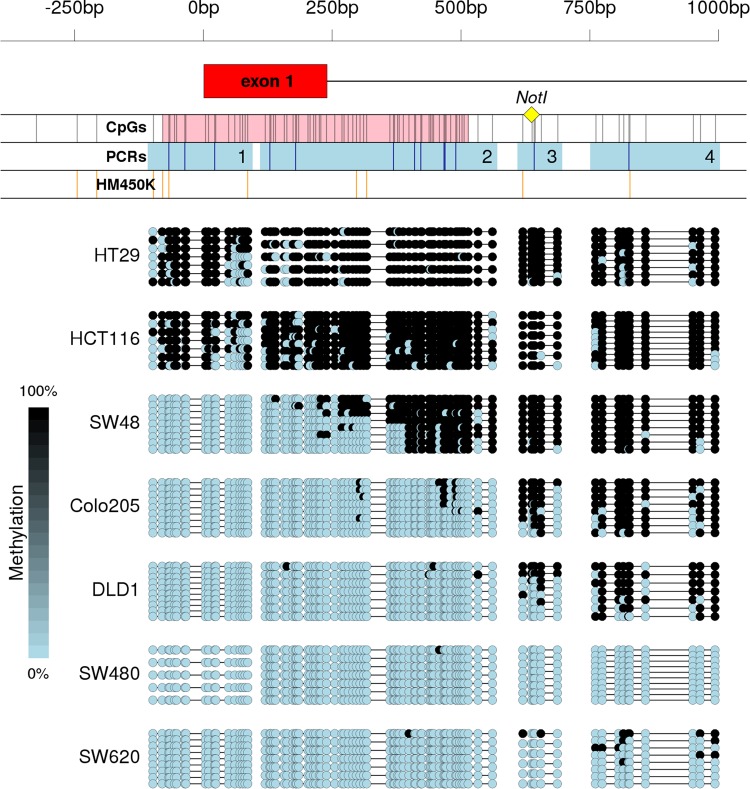
Figure 5.
Methylation of the 5′-associated region of VWA2 in CRC cell lines. On top, a scheme of the region. Symbols and tracks identical to those in Fig. 1. At the bottom, bisulfite sequencing results. Analyses were performed in 4 separate PCRs. Every line represents and individually sequenced clone. Dots represent unmethylated (blue) or methylated (black) CpG sites. Primary cancer-derived cell lines are organized from higher (HT29) to lower (SW480) methylation levels. The lymph node-derived cell line SW620 is shown at the bottom.

