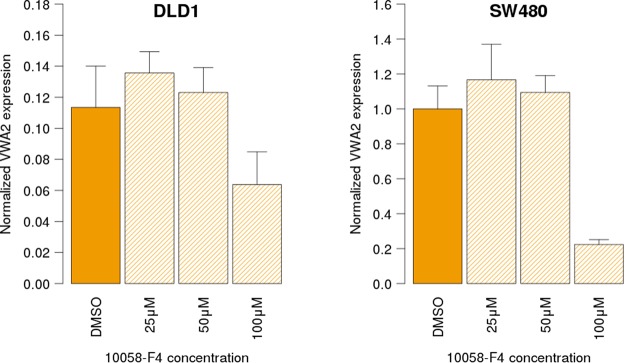
Figure 8.
VWA2 transcriptional levels in DLD1 (left) and SW480 (right) CRC cell lines, after 48 h treatment with the c-myc inhibitor 10058-F4 at different concentrations. Solid bars indicate control cells treated with the vehicle (DMSO). Dashed bars indicated the cells treated with vehicle + 25 µM, 50 µM and 100 µM 10058-F4. mRNA levels were normalized against the highest expressing cell line (SW480) using GAPDH and TPT1 as reference housekeeping genes. Experiments were performed in duplicate. Error bars indicate the standard error.

