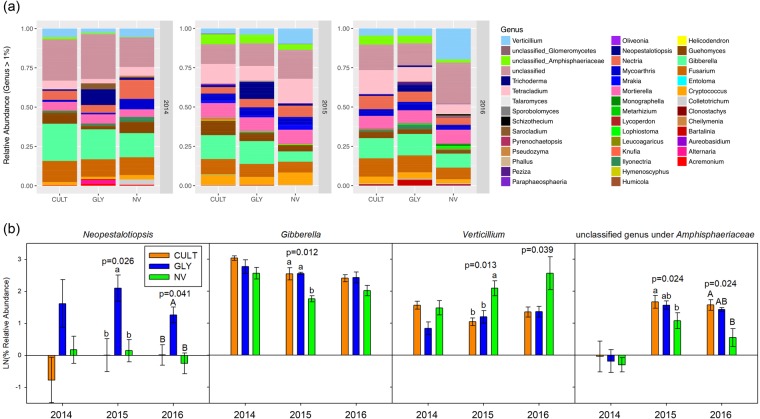
Figure 3.
Mean fungal relative abundance at genus level. (a) Full fungi profile (>1%) in the soil from Cultivation (CULT), Glyphosate (GLY) and Natural vegetation (NV) field treatments (n = 4) and (b) Selective fungi that were different in relative abundance (n = 4) with standard errors. The statistical differences were tested by using one-way analysis of variance (ANOVA) followed with Tukey HSD test comparing log mean relative abundance at α = 0.05. The p-values were derived from ANOVA.

