
Figure 3.
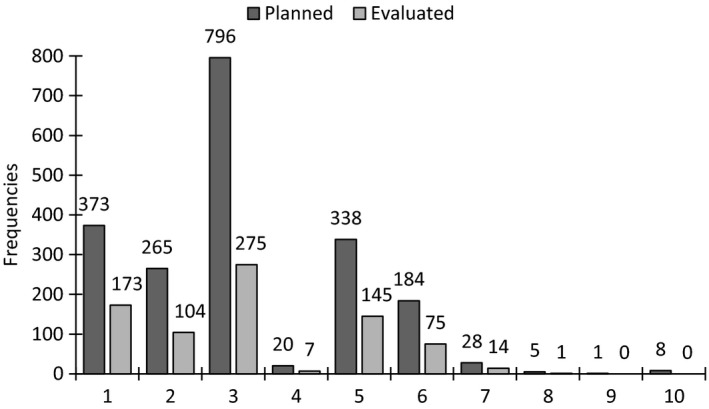
Frequencies of planned and evaluated nursing interventions. The figures on the x axis represent planned and evaluated interventions regarding: 1. dietary support, 2. pharmaceutical review, 3. Nutritional treatment, 4. registration, 5. weight control, 6. oral care, 7. information/education regarding nutrition, 8. other intervention—malnutrition, 9. care in the final stages of life—malnutrition, 10. and declining all preventive interventions—malnutrition