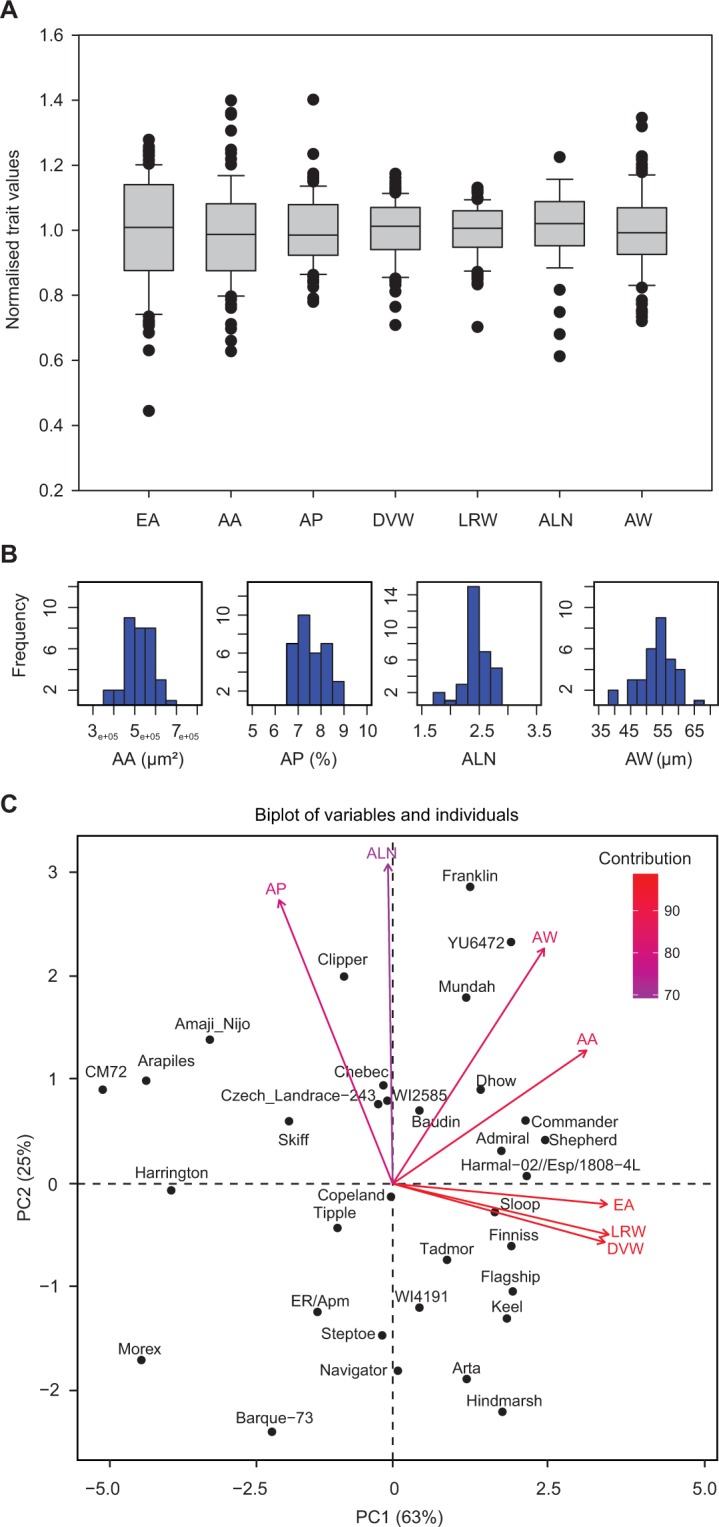
Figure 2.

Variation in transverse grain measurements observed across 33 barley genotypes. (A) Box plot of normalised data showing the variation in different grain measurements. (B) Frequency distribution plots of the four aleurone measurements. (C) Principal Component Analysis separates the genotypes based on the seven transverse measurements (variables). EA, endosperm area; AA, aleurone area; AP, aleurone proportion; DVW, grain dorsal-ventral distance; LRW, transverse grain left-right width; ALN, aleurone layer number; AW, aleurone width.
