Figure 2.
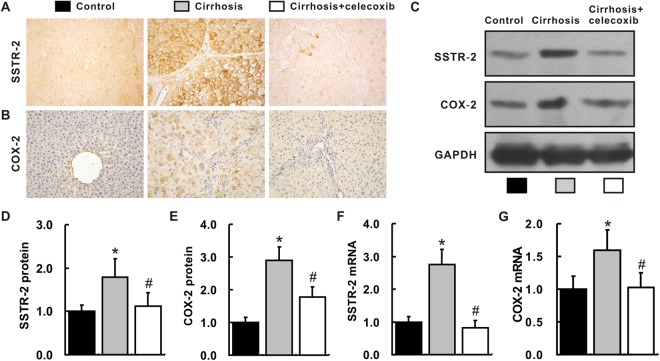
Up-regulation of SSTR-2 and COX-2 expression in cirrhotic livers. (A,B) Hepatic expression of the SSTR-2 (A) and COX-2 proteins (B) (IHC, magnification ×400). (C) Hepatic expression of the SSTR-2 and COX-2 proteins, as determined by Western blotting. The group of blots was cropped from different gels. (D,E) Quantitative statistical analysis of the Western blots examining the hepatic expression of SSTR-2 (D) and COX-2 (E). (F,G) Hepatic expression of the SSTR-2 (F) and COX-2 (G) mRNAs, as quantified by qRT-PCR. n = 6 samples per group. *P < 0.05 compared with the control group, #P < 0.05 compared with the cirrhosis group.

