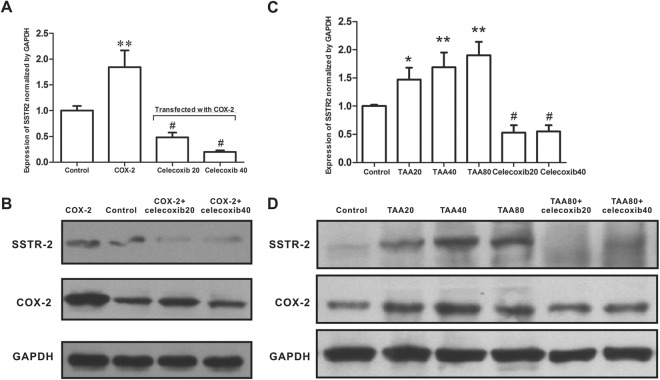
Figure 3.
Enhanced SSTR-2 expression by COX-2 overexpression and the TAA treatment. (A) Relative level of SSTR-2 expression in L02 cells transfected with the COX-2 overexpression plasmid following the addition of celecoxib at a final concentration of 20 or 40 μM (Western blot). Control group: L02 cells transfected with the empty pcDNA3.1 plasmid; COX-2 group: L02 cells transfected with the COX-2 overexpression plasmid; COX-2+ celecoxib20 group: L02 cells transfected with the COX-2 overexpression plasmid and treated with 20 μM celecoxib; COX-2+ celecoxib40 group: L02 cells transfected with the COX-2 overexpression plasmid and treated with 40 μM celecoxib. **P < 0.01 compared with the control group, #P < 0.01 compared with the COX-2 group. (B) Western blots showing SSTR-2 and COX-2 levels in each group. The group of blots was cropped from different gels. (C) Western blot analysis of cells treated with final concentrations of 20, 40, or 80 mg/L TAA or the combination of 80 mg/L TAA and celecoxib at final concentrations of 20 or 40 μM. Control: L02 cells treated with vehicle; TAA20, TAA40 and TAA80: L02 cells treated with 20, 40, and 80 mg/L TAA, respectively; TAA80+ celecoxib20: L02 cells treated with TAA (80 mg/L) plus celecoxib (20 μM); TAA80+ celecoxib40: L02 cells treated with TAA (80 mg/L) plus celecoxib (40 μM). *P < 0.05 compared with the control group. **P < 0.01 compared with the control group; #P < 0.01 compared with the TAA80 group. (D) Western blots showing SSTR-2 and COX-2 levels in each group. n = 3 samples per group. The group of blots was cropped from different gels.

