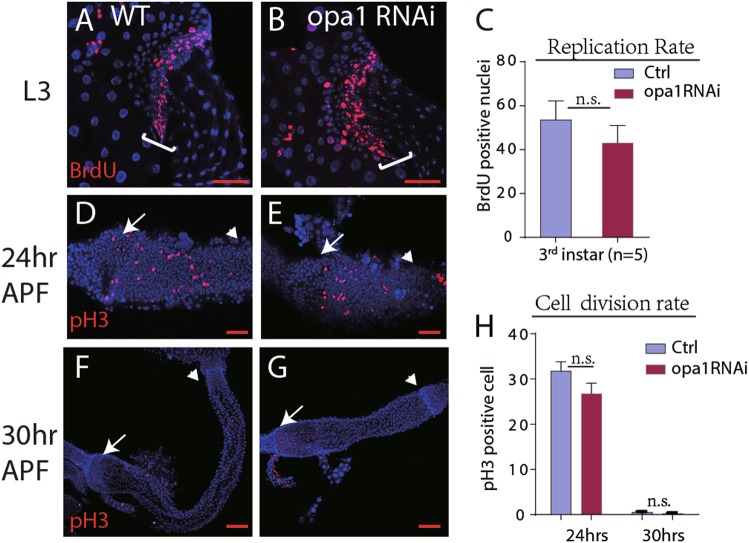
Fig. 3. Stem/progenitor cell proliferation is largely unaffected by opa1RNAi.
a–c Replication rate was measured by BrdU feeding in stage-matched third larvae. Representative images are shown as a (ctrl) and b (opa1 RNAi). The HPZ zone is outlined with a white bracket. Quantification shown in c. No statistical significance was found, n = 5. d–h Proliferation rate was indicated by pH3-positive nuclei in larvae hindgut in 24 h APF (d, e) and 30 h APF (f, g). d and f are the Controls; e and g are opa-1 RNAi larvae. Quantification shown in h. No statistical significance was found, n = 6. Error bars represent standard deviation (STDEV) in c and h. Arrows pointed to the boundary of the midgut and the hindgut, and TOTO3 stained nuclei in blue. Scale bar for 100 µm

