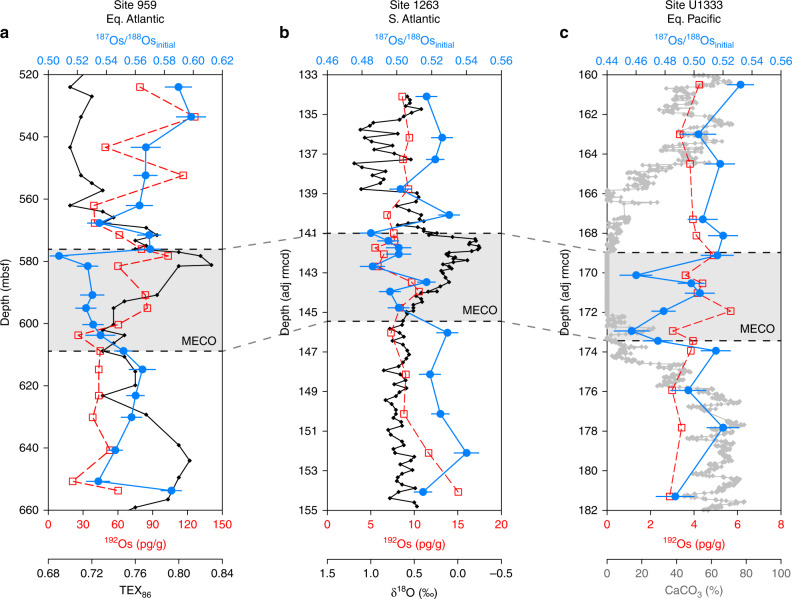
Fig. 1.
Osi values (in blue) and 192Os concentrations (in red) for the analyzed middle Eocene sediments from the three different sites. a ODP Site 959; b ODP Site 1263; c IODP Site U1333. The MECO interval is defined based on TEX86 values for Site 959 (in black; Cramwinckel et al.13) and bulk carbonate stable oxygen isotope ratios (δ18O) for Site 1263 (in black; Bohaty et al.10). The MECO is characterized by low carbonate content at Site U1333 (in grey; Westerhold et al.84). The error bars indicate fully propagated analytical uncertainties (2σ)

