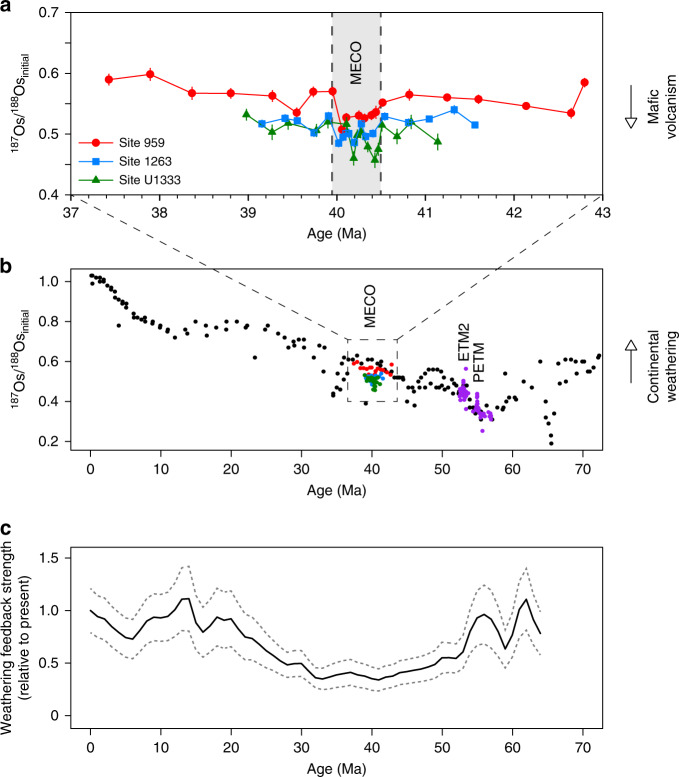
Fig. 2.
Comparison of Osi records from the MECO with Osi records from the PETM and ETM2, shown against the overall Osi evolution of the Cenozoic and the relative weathering feedback strength of the Cenozoic. a MECO data from Site 959 (in red), Site 1263 (in blue) and Site U1333 (in green) plotted against age (GTS2012)74. See Methods for discussion of the age models for the study sites. b MECO data from Sites 959, 1263, and U1333 (this study); PETM and ETM2 data from DSDP Site 549 (in purple) as published in Peucker-Ehrenbrink & Ravizza15; Cenozoic data from ferromanganese crusts D11 and CD29 (in black) as published in Klemm et al.27 and Burton28, respectively, based on the updated age model of Nielsen et al.29. c Model estimates of the relative continental weathering feedback strength of the Cenozoic as published in Caves et al.57, based on their CO2 scenario 1 and a logarithmic expression for the weathering feedback

