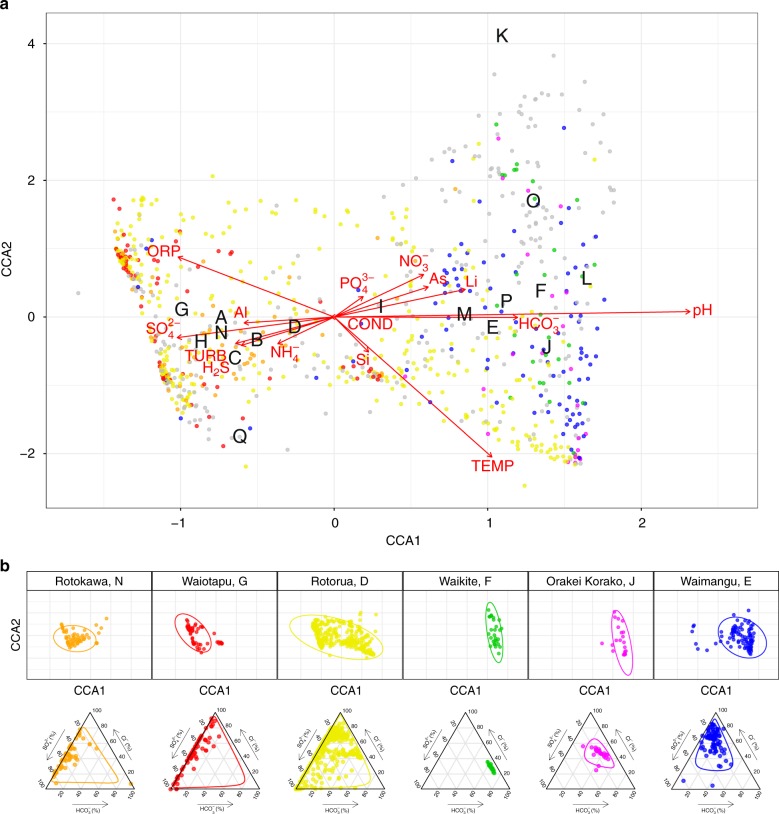
Fig. 3.
Constrained correspondence analysis (CCA) of beta diversity with significant physicochemistry. a A scatter plot of spring community dissimilarities (n = 923), with letters corresponding to centroids from the model for geothermal fields (A–Q; White Island, Taheke, Tikitere, Rotorua, Waimangu, Waikite, Waiotapu, Te Kopia, Reporoa, Orakei Korako, Whangairorohea, Ohaaki, Ngatamariki, Rotokawa, Wairakei-Tauhara, Tokaanu, Misc). Coloured communities are from fields represented in the subpanel. Constraining variables are plotted as arrows (COND: conductivity, TURB: turbidity), with length and direction indicating scale and area of influence each variable had on the model. b The top panel represents a subset of the full CCA model, with select geothermal fields shown in colour (including 95% confidence intervals). The bottom panel shows their respective geochemical signatures as a ratio of chloride (Cl−), sulfate , and bicarbonate

