Figure 1.
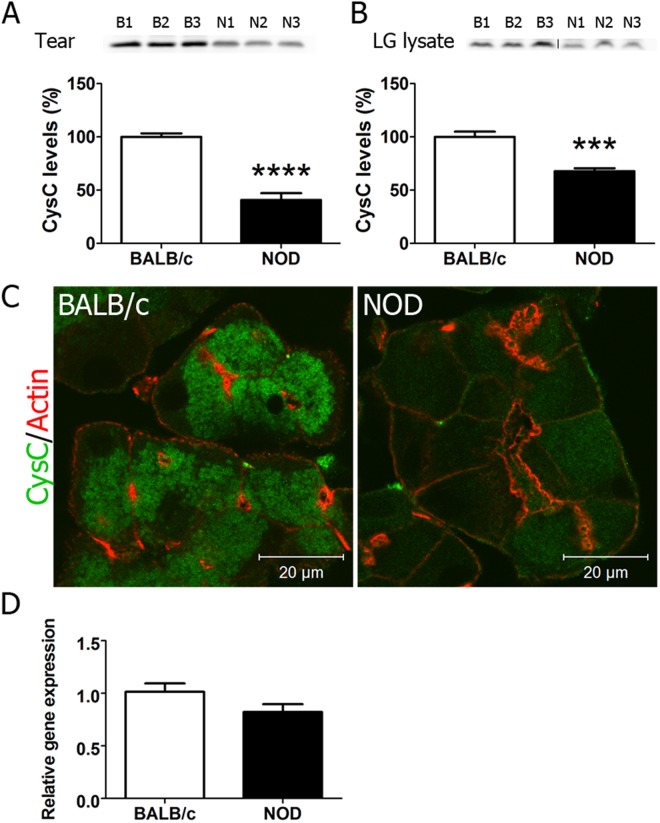
Expression of Cys C in Lacrimal glands and Lysates of Male NOD mice compared to BALB/c mice. Cys C concentration in (A) tears (n = 7 NOD and 7 BALB/c) and (B) LG lysates (n = 6 BALB/c and 6 NOD) from 12 week males as determined by Western blotting and quantification of Cys C signal by pixel intensity per µg protein. Representative blot is shown, Full length blot is shown in (Supplementary Fig. 1). Values are presented as a percentage of those detected in BALB/c mouse samples, set at 100%. Error bars show SE; ***p < 0.001, ****p < 0.0001. (C) Immunofluorescence labeling of sections from LG of 12 week male BALB/c and NOD mouse LG for Cys C. Green, Cys C (labeled with Alexa-488 conjugated secondary antibody) and red, actin filaments labeled with rhodamine-phalloidin. (D) Relative gene expression of Cys C in LG acinar cells from 12 week male BALB/c (n = 6) and NOD (n = 6) mice isolated by laser capture microdissection.

