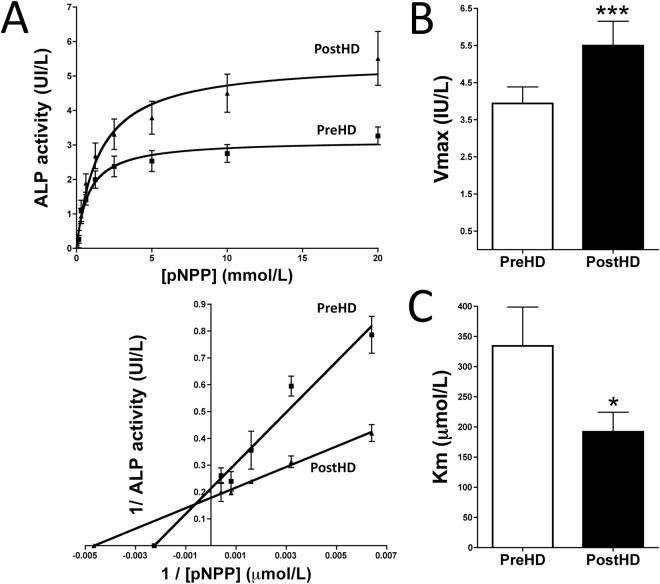
Figure 1.
Kinetic analysis of ALP activity in plasma samples before and after dialysis. (A) Representative Michaelis-Menten saturation curves to determine the Km and Vmax of pNPP hydrolysis in pre- and post-dialysis plasma samples under physiological conditions (top). Representative Lineweaver-Burk plot (bottom). The curves for each patient were used to determine Vmax (B) and Km (C) using nonlinear regression, as described in the Methods section. Results are presented as mean ± SEM (n = 40), and were compared by the Wilcoxon matched pairs test. *P < 0.05; ***P < 0.001.

